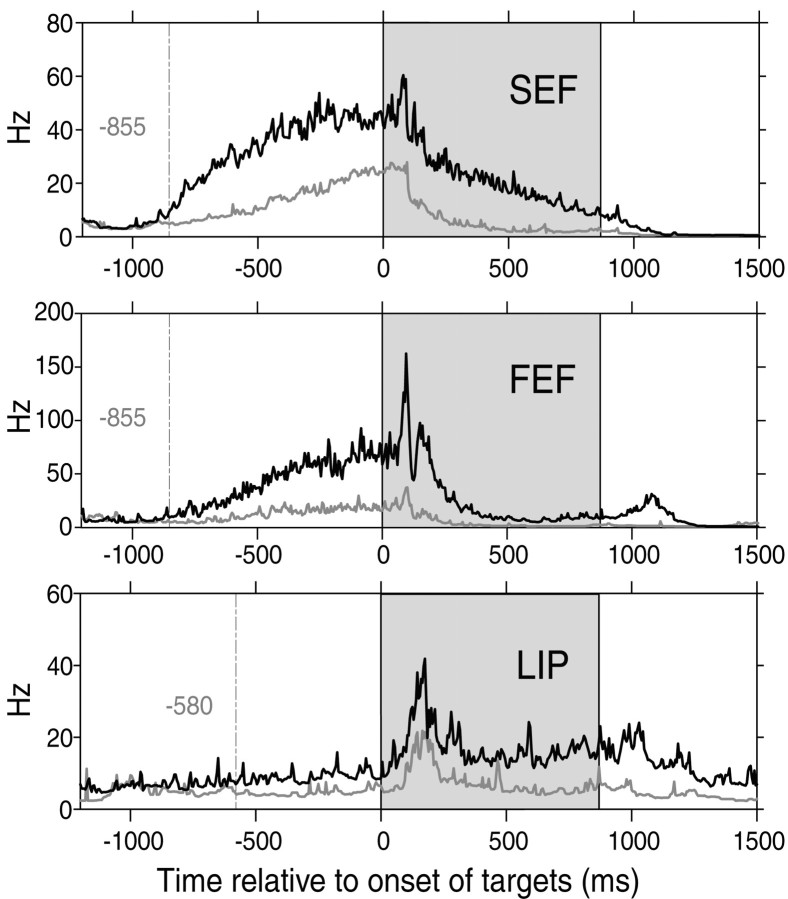
Fig. 5.
Strong modulation of anticipatory activity in three cortical eye fields. For a representative cell in each area, the 1/ISI plot is shown for the RF trials (black) and the nRF trials (gray) in the FC task. The difference in cell activity between the RF trials and the nRF trials is clear in the fixation period, before the onset of the targets. The dotted line in each 1/ISI plot indicates the time when the activities for the RF trials and for the nRF trials first displayed a significant difference according to the Running Mann comparison (see Materials and Methods). The shaded area indicates the visual period.

