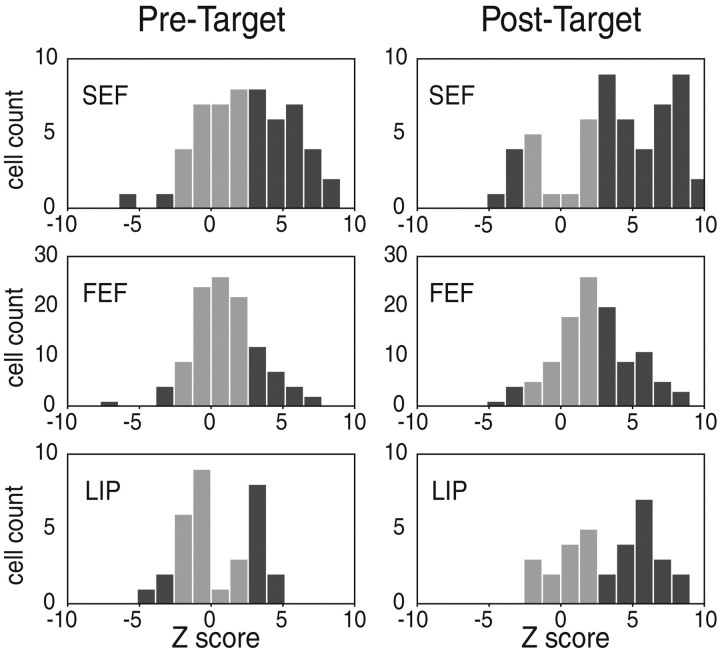
Fig. 7.
Distribution of Z scores for pretarget and post-target activity. The spike counts for the RF trials and the nRF trials were compared using the WMW test for two separate time windows. Histograms of the results indicate how many cells showed significantly different activity. Black bars indicate cells with Z scores above 2.58 (RF > nRF) or below −2.58 (nRF > RF; p < 0.01). Gray bars indicate cells with nonsignificant Zscores. Left, Pretarget time window: 49.1% (27 of 55) of SEF cells, 22.5% (25 of 111) of FEF cells, and 31.3% (10 of 32) of LIP cells show greater activity during the RF trials than during the nRF trials. Right, Post-target window: 67.3% (37 of 55) of SEF, 43.2% (48 of 111) of FEF, and 56.3% (18 of 32) of LIP cells show greater activity during the RF trials than during the nRF trials.

