Fig. 3.

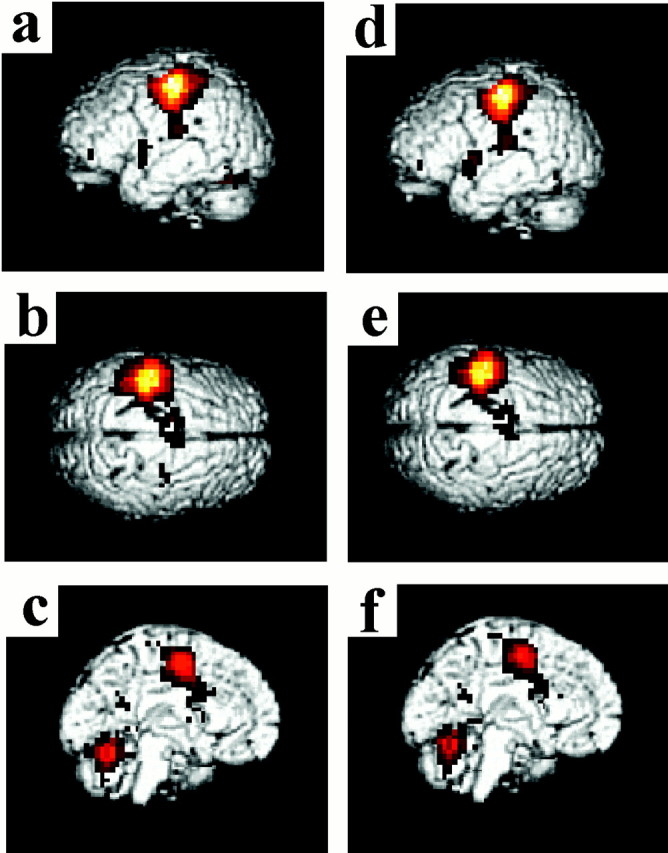
The activations displayed on three-dimensional (3D) reconstructions of the template brain (MNI).a–c, The contrast nonsynergistic digit movement versus rest. d–f, Synergistic digit movements versus rest. The M1/S1 cortex is the area that showed the largest BOLD signal increase when the digit movement tasks were compared with rest (nonsynergistic vs rest: x = −40, y = −24, z = 56;t value, 40.50; synergistic vs rest:x = −40, y = −24,z = 56; t value, 42.19), but there were no significant differences in the degree of activation between the two tasks (p > 0.001 without a correction for multiple comparisons). Additionally, both tasks were associated with significant activations (p < 0.05 corrected) located at the left PMD, SMA/CMA, postcentral sulcus, anterior part of the intraparietal sulcus, and the bilateral parietal operculum, lateral fissure, and lateral cerebellum (the left putamen and thalamus were also active, but this is not shown on these 3D projections of the brain). The top row shows the left hemisphere (a, d), the middle row displays the top view (b, e), and the bottom row highlights the left medial wall (c, f). The activation maps have been thresholded at t = 3.79 for display purposes.
