
Fig. 1.
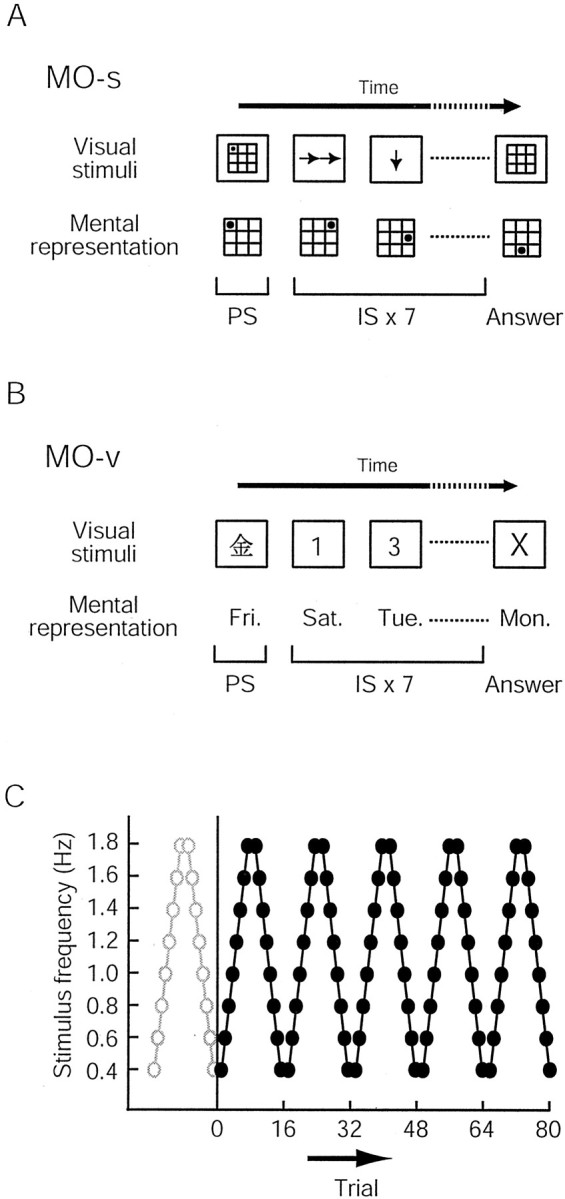
Experimental paradigms. A, MO-s.B, MO-v. The top row illustrates the visual stimuli used in each version of the task, and the bottom row illustrates the expected mental representations in the subjects. For both tasks, a trial started with the presentation of a prime stimulus (PS), followed by the presentation of seven instruction stimuli (IS). Subjects serially manipulated mental representations according to the instruction stimulus. C, Schematic representations of the experimental procedure. The frequency of presentation of the instructional stimuli was constant within a trial but varied across trials. Eight different stimulus frequencies (0.4–1.8 Hz in 0.2 Hz steps) were used for each task. Each task was broken into one practice block (open circles) and five experimental blocks (filled circles). The stimulus frequency was serially increased in the first half of the block and then serially decreased in the second half.