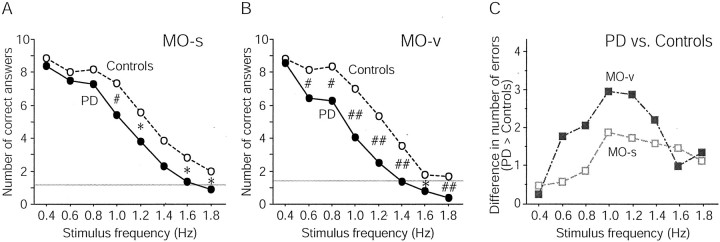
Fig. 2.
The number of correct answers for the MO-s (A) and MO-v (B) in patients with PD and controls. The number of correct answers for both groups decreased as the stimulus frequency increased. At stimulus frequencies of ≥1.4 Hz, their performance approached chance (gray horizontal line) or even below.C, Difference in the number of correct answers between patients with PD and controls at each stimulus frequency for each task. The performance deficit in patients with PD was most prominent at 1.0 Hz in both MO-s and MO-v. Moreover, the deficit in patients with PD was greater in MO-v compared with MO-s. *p < 0.05;#p < 0.01;##p < 0.001.

