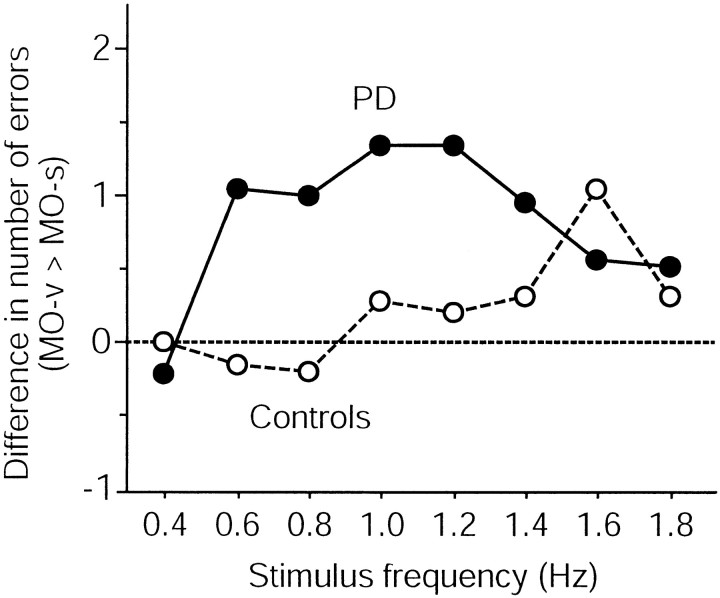
Fig. 3.
Difference between the number of correct answers for MO-s and MO-v at each stimulus frequency for each group. At 0.4 Hz, the number of correct answers was the same for both tasks and for both groups. At greater speeds, the PD group exhibited a greater deficit in MO-v than MO-s. This divergence in performance level was not observed for controls. The performance at ≥1.4 Hz was difficult to evaluate because the number of correct answers was near the chance level, especially for the PD group for MO-v. The horizontal dotted line indicates equal performance level of MO-v and MO-s.

