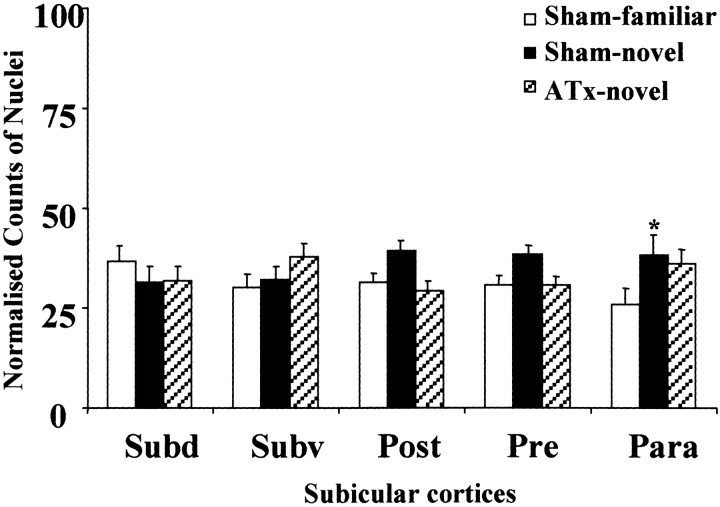
Fig. 7.
Normalized counts of Fos-positive nuclei in the subicular complex. Data are shown as means ± SE. All normalized data sum to 100 (see Materials and Methods). See Table 1 for abbreviations. Significance of group differences in normalized counts: *p < 0.05 (Sham-familiar vs Sham-novel).

