

Abstract
Intercellular Ca2+ waves in astrocytes are thought to serve as a pathway of long-range signaling. The waves can propagate by the diffusion of molecules through gap junctions and across the extracellular space. In rat striatal astrocytes, the gap-junctional route was shown to be dominant. To analyze the interplay of the processes involved in wave propagation, a mathematical model of this system has been developed. The kinetic description of Ca2+ signaling within a single cell accounts for inositol 1,4,5-trisphosphate (IP3) generation, including its activation by cytoplasmic Ca2+, IP3-induced Ca2+ liberation from intracellular stores and various other Ca2+transports, and cytoplasmic diffusion of IP3 and Ca2+. When cells are coupled by gap junction channels in a two-dimensional array, IP3 generation in one cell triggers Ca2+ waves propagating across some tens of cells. The spatial range of wave propagation is limited, yet depends sensitively on the Ca2+-mediated regeneration of the IP3 signal. Accordingly, the term “limited regenerative signaling” is proposed. The gap-junctional permeability for IP3 is the crucial permissive factor for wave propagation, and heterogeneity of gap-junctional coupling yields preferential pathways of wave propagation. Processes involved in both signal initiation (activation of IP3 production caused by receptor agonist) and regeneration (activation of IP3production by Ca2+, loading of the Ca2+ stores) are found to exert the main control on the wave range. The refractory period of signaling strongly depends on the refilling kinetics of the Ca2+ stores. Thus the model identifies multiple steps that may be involved in the regulation of this intercellular signaling pathway.
Keywords: intercellular calcium waves; glial cells; inositol 1,4,5-trisphosphate; phospholipase C; gap junctions; mathematical model
Ca2+signals provide a mechanism for the integration and transmission of information. In astrocytes, the most abundant glial cell type in the CNS, Ca2+ signals are observed in response to neurotransmitters (Verkhratsky et al., 1998). These can travel as intercellular Ca2+ waves (ICWs) over several hundred micrometers and may thus provide a basis for a long-range signaling pathway (Cornell-Bell et al., 1990). ICWs have been described in a great number of primary astrocyte cultures (Charles and Giaume, 2002), in organotypic cultures (Dani et al., 1992;Harris-White et al., 1998), and in intact retina (Newman and Zahs, 1997), as well as in many other tissues, including epithelial cells (Sanderson, 1995) and the liver (Robb-Gaspers and Thomas, 1995;Dupont et al., 2000b). Recently, Ca2+ increases have been observed to trigger the release of glutamate from astrocytes and thereby modulate synaptic transmission (Araque et al., 1999).
A mechanism for ICWs was deduced from experiments performed on airway epithelial cells (Sanderson et al., 1990) and formulated as a mathematical model (Sneyd et al., 1994, 1995). It is based on the diffusion of inositol 1,4,5-trisphosphate (IP3) from a stimulated cell through gap junction channels into neighboring cells where it elicits Ca2+ release from internal stores. Accordingly, ICW properties are determined by the production of IP3 in a single cell and its diffusion and degradation in downstream cells. By contrast, in the long-ranging periodic Ca2+ waves in the liver, a messenger diffusing through gap junction channels appears to be regenerated in each participating cell (Robb-Gaspers and Thomas, 1995), and mathematical models addressing the underlying mechanisms are being developed (Höfer, 1999; Dupont et al., 2000a).
In the present paper, a mathematical model is proposed for astrocytic ICWs and compared with the experimental data. In astrocytes, the propagation process is complex, because besides gap junction-mediated intercellular diffusion (Giaume and Venance, 1998), the release of ATP into the extracellular space provides an additional route contributing to ICWs (Hassinger et al., 1996; Cotrina et al., 1998; Guthrie et al., 1999). Either the gap-junctional or the extracellular pathway, or both, can be present, depending on the origin of the astrocytes and the trigger for ICWs (Scemes et al., 2000; Charles and Giaume, 2002). The present study is based on previous experimental work performed with astrocytes cultured from rat striatum, in which ICWs predominantly propagate through gap junctions (Venance et al., 1995, 1997, 1998;Giaume and Venance, 1998). A further important finding was the existence of a regenerative step in the propagation mechanism: IP3 is not only produced in the cell directly stimulated with agonist, but can also be generated in downstream cells, probably through the activation of phospholipase C (PLC) by Ca2+. The theoretical analysis presented shows that the proposed mechanism including IP3diffusion and regeneration is indeed compatible with the limited spatial range of ICWs seen in the experiments and can account for many of the observed features of wave propagation. The model is then used to elucidate several critical steps that control the properties of this long-range signaling pathway.
MATHEMATICAL MODEL
The calcium and IP3 dynamics are modeled by describing the Ca2+ transport processes and IP3 production and degradation in a single astrocyte. The interior of each cell is spatially resolved, such that the intracellular diffusion of Ca2+ and IP3 is also accounted for. A two-dimensional network of cells is considered, reflecting the monolayer arrangement of an astrocyte culture. Neighboring cells in the network are coupled by gap junction channels.
Based on the detailed pharmacological characterization of ICW propagation in rat striatal astrocytes by Venance et al. (1997), the scheme of Figure 1 is proposed for the intracellular dynamics. It includes the main Ca2+ transport processes known to be present in astrocytes: Ca2+ release from and uptake into IP3-sensitive stores of the endoplasmic reticulum (ER) and Ca2+extrusion and entry across the plasma membrane. External agonists acting on G-protein-coupled receptors stimulate PLCβ. The resulting rise in IP3 initiates Ca2+ discharge from the ER through IP3 receptor channels (IP3Rs). In the experiments, agonist was applied locally to a single cell, which will be termed “stimulated cell.” Others cells in the field, referred to as “downstream cells,” do not receive the agonist stimulus.
Fig. 1.

Scheme of the Ca2+ and IP3 dynamics included in the model. Solid,dashed, and dotted arrows indicate reaction/transport steps, regulatory interactions, and molecular diffusion, respectively. The bold quantities indicate the model variables. R, Agonist receptor; G, G-protein (active forms are denoted by asterisks);IP3Ri, inactive conformation of the IP3 receptor. For further abbreviations and explanation see Mathematical Model.
Ca2+ elevation in astrocytes stimulates the production of IP3 (Venance et al., 1997). This correlates with the finding that the PLCδ isoform is preferentially expressed in astrocytes within the CNS (Rebecchi and Pentyala, 2000). PLCδ is activated by Ca2+ signals in the physiological concentration range, and it may thus provide a molecular basis for the regeneration of IP3 in nonstimulated cells. In the model we therefore include two distinct production terms for IP3, one corresponding to PLCβ, which is activated through G-protein-coupled receptors exclusively in the stimulated cell, and the other to PLCδ, activated by Ca2+ elevation in the stimulated cell and in downstream cells.
The reaction scheme of Figure 1 is translated into a system of balance equations for the four variables: cytoplasmic Ca2+ concentration (C), ER store Ca2+ concentration (S), IP3 concentration (I), and active fraction of IP3R (R). It reads:
| Equation 1 |
| Equation 2 |
| Equation 3 |
| Equation 4 |
where vPLCβ,vPLCδ, vdeg,vrel,vSERCA,vin, andvout denote the rates of PLCβ, PLCδ, IP3 degradation, Ca2+ release from the ER, Ca2+ pumping into the ER, Ca2+ influx across the plasma membrane, and Ca2+ extrusion. The last terms in the equations for cytoplasmic Ca2+ and IP3 give the concentration changes caused by cytoplasmic diffusion, with the diffusion coefficientsDCa andDIP3, respectively. In addition to the activation of the IP3R by cytoplasmic Ca2+, we also account for a slower Ca2+-induced inactivation (Bezprozvanny et al., 1991; Tang et al., 1996), reflected by Equation 3. The rates of receptor inactivation and recovery are denoted by vinact andvrec, respectively. In Equations 1 and2, the effects of (fast) Ca2+ buffering in the cytoplasm and in the ER stores are accounted for by defining effective rate constants and an effective diffusion coefficientDCa (Wagner and Keizer, 1994;Höfer et al., 2001).
The cells are coupled through gap junction channels to their nearest neighbors (Finkbeiner, 1992; Venance et al., 1997). In primary cultures of astrocytes used for the Ca2+ imaging experiments, counting the cells surrounding a stimulated cell in concentric rows yielded 7 ± 1 (n = 7), 15.5 ± 2.5 (n = 11), and 22 ± 3 (n = 6) cells for the first, second, and third rows, respectively. Thus a regular array of square cells (with 8 × N cells in theN-th row) is used as a reasonable approximation in the model simulations. Cells are coupled by diffusive gap-junctional fluxes of IP3 and Ca2+. Denote the spatial coordinates by x and y, and consider a cell–cell contact located at x = ξ. Assuming Fick's law, the intercellular flux conditions read:
| Equation 5a |
| Equation 5b |
where (ξ−, y) and (ξ+, y) denote the spatial positions immediately at the gap junctions in the left and right cells, respectively. Analogous conditions hold for cell–cell boundaries along the y-direction. The parametersPCa andPIP3 are the gap-junctional permeabilities for Ca2+ and IP3. They may differ because of intrinsic properties of gap junction channels (e.g., charge and size selectivity) and because of the effect of fast Ca2+buffering included in PCa(Höfer, 2001). In particular, in the following we assume that, because of calcium buffering, PCa ≪PIP3.
The rate laws are chosen as follows. IP3-induced and Ca2+-induced Ca2+ release is modeled according to the empirical fit in Bezprozvanny et al. (1991) as:
| Equation 6 |
where the meanings of the various parameters in this and the following rate expressions are given in Table1. The release is a function of the IP3R fraction in the active state R; the rates of receptor inactivation by Ca2+binding and recovery are taken as:
| Equation 7 |
(cf. Bezprozvanny et al., 1991; Atri et al., 1993).
Table 1.
Model parameters
| Parameter | Symbol | Value |
|---|---|---|
| Rate constant of calcium leak from ER | k1 | 0.0004 sec−1 |
| Rate constant of calcium release through IP3R | k2 | 0.08 sec−1 |
| Rate constant of SERCA pump | k3 | 0.5 sec−1 |
| Rate of calcium leak across the plasma membrane | v40 | 0.025 μm/sec−1 |
| Maximal rate of activation-dependent calcium influx | v41 | 0.2 μm/sec−1 |
| Rate constant of calcium extrusion | k5 | 0.5 sec−1 |
| Rate constant of IP3R inactivation | k6 | 4 sec−1 |
| Maximal rate of PLCδ | v7 | 0–0.05 μm/sec−1 |
| Rate of PLCβ | v8 | 4 × 10⁻⁴ − 3 μm/sec−1 |
| Rate constant of IP3 degradation | k9 | 0.08 sec−1 |
| Half-saturation constant for IP3activation of IP3R | KIP3 | 0.3 μm |
| Half-saturation constant for calcium activation of IP3R | Ka | 0.2 μm |
| Half-saturation constant for calcium inhibition of IP3R | Ki | 0.2 μm |
| Half-saturation constant for calcium activation of PLCδ | KCa | 0.3 μm |
| Half-saturation constant for agonist-dependent calcium entry | Kr | 1 μm |
| Diffusion coefficient of IP3 | DIP3 | 280 μm sec−2 |
| Effective diffusion coefficient of calcium | DCa | 20 μm sec−2 |
| Gap-junctional permeability of IP3 | PIP3 | 1–5 μm sec−1 |
| Effective gap-junctional permeability of calcium | PCa | 0.01PIP3 |
| Ratio of the effective volumes for Ca2+ of cytoplasm and ER | β | 20 |
The second component of the positive feedback between Ca2+ and IP3, PLCδ activity, is modeled by:
| Equation 8 |
giving a close fit to the data of Pawelczyk and Matecki (1997). The rate of PLCβ is controlled by the agonist; in the model we assign it a constant value for a fixed period of time. Assuming a simple collision scheme for the activation of PLCβ by G-protein, one obtains for its activity at saturating ligand concentrations:
| Equation 9 |
where κG and α0denote, respectively, the ratio of the dissociation constant for G-protein binding to PLCβ to the total concentration of G-protein, and the ratio of the total concentration of agonist receptors to the dissociation constant for receptor binding to the G-protein. Ca2+ pumping and IP3degradation are modeled by linear rate laws:
| Equation 10 |
The Ca2+ entry rate expression accounts for a small leak flux that is always present and an agonist-dependent influx (which can be receptor-operated or store-operated Ca2+ influx, or both). For simplicity, the latter is made a function of IP3 concentration as a measure of agonist dose (cf. Dupont and Goldbeter, 1993):
| Equation 11 |
The rate constants for the Ca2+dynamics (k1 throughk5,v40,v41) and of PLCβ were estimated by fitting the model to resting values of cytosolic and stored Ca2+, and to agonist-evoked Ca2+ spikes and the store emptying kinetics measured by Venance et al. (1997) (T. Höfer, unpublished results). Other parameters (k9,DCa,DIP3,Ka,KIP3,Ki,KCa) were taken from the experimental literature. No direct measurements exist in astrocytes for the maximal rate of PLCδ and the permeabilities of gap junction channelsPIP3 andPCa, yet these parameters are expected to be crucial for the model behavior. Therefore, the model solutions are analyzed under systematic variation of these parameters. Estimates of gap-junctional permeability ranges are available for other cell types and permeating substances (Verselis et al., 1986; Eckert et al., 1999) and are used as guidance. The values of the model parameters are listed in Table 1.
Model solutions were obtained numerically by discretizing the system of Equations 1-4 on a regular square grid, using explicit Euler stepping for the kinetics combined with an alternating direction implicit (ADI) scheme for the diffusion terms (Morton and Mayers, 1993). The intercellular flux conditions (Eqs. 5a, 5b) are discretized by a scheme used previously (Sneyd et al., 1995; Höfer et al., 2001). To adjust numerical parameters, one-dimensional solutions were obtained with an implicit finite-difference scheme and compared with solutions computed with a method of lines/adaptive-stepsize Runge–Kutta scheme. Space and time steps chosen for the ADI scheme were 5 μm and 50 msec, respectively.
RESULTS
Single-cell responses to stimulation with receptor agonists of different potency
The experimental data show that saturating doses of different agonists evoke responses of different magnitude. The Ca2+ amplitudes increased in the following order: carbachol/methoxamine < glutamate (Glu) < endothelin-1 (ET-1) (Venance et al., 1997). A molecular basis for this behavior is indicated by the observation that α1-adrenergic (for methoxamine) and muscarinic (for carbachol) receptors are expressed at much lower overall densities (and are distributed more heterogeneously) than glutamate and endothelin receptors in astrocytes cultured from rat striata (Venance et al., 1998). In the single-cell model, the Ca2+ amplitudes computed for different relative receptor densities α0 reproduce this behavior (Fig. 2). Agonist specificity of the response may be determined further by the G-protein used and by its coupling to PLC; cf. Equation 9.
Fig. 2.

Agonist response in the model of a single cell. Activation level was varied by changing the relative receptor density at saturating agonist dose. This translates into different activities of PLCβ (cf. Eq. 9). Shown are the Ca2+ responses in the presence (solid line) and absence (dashed line) of PLCδ. The duration of activation was 4 sec.
The presence of the kinetic term for Ca2+-activated PLCδ induces a sharp threshold in the dose–response curve for the calcium amplitude (Fig.2, solid line, at α0 ∼ 10−3). The [Ca2+]i amplitudes generated by the model are in the range of the experimentally observed values.
Agonist-evoked intercellular Ca2+ waves
In the experimental system, the focal administration of a sufficiently potent PLCβ-activating stimulus to a single astrocyte gave rise to an ICW (Venance et al., 1997). In the model, transient PLCβ activity in one cell initiates an ICW with the correct range of propagation (Fig. 3A). The pattern of [Ca2+]i(cytoplasmic Ca2+ concentration) transients in the excited cells is in close agreement with the experimental data. The amplitude is largest in the stimulated cell and declines over a few cells to a plateau, at which it remains for a number of cells before failing abruptly (Fig. 3B). The speed of intercellular propagation is found to be determined primarily by the intercellular delays, as observed in the experiments. The average wave speed in the model for signal propagation through the first three rows of cells is in the same range as the speed computed from experimental data: 8–10 μm/sec and 15–20 μm/sec, respectively. In the model, the propagation speed between neighboring cells decreases as the distance from the stimulated cell increases. Interestingly, despite the good agreement of the overall time course and amplitude behavior between model and experiment, this speed decrease is at variance with at least some of the experimental data, showing a practically constant speed (Venance et al., 1997).
Fig. 3.
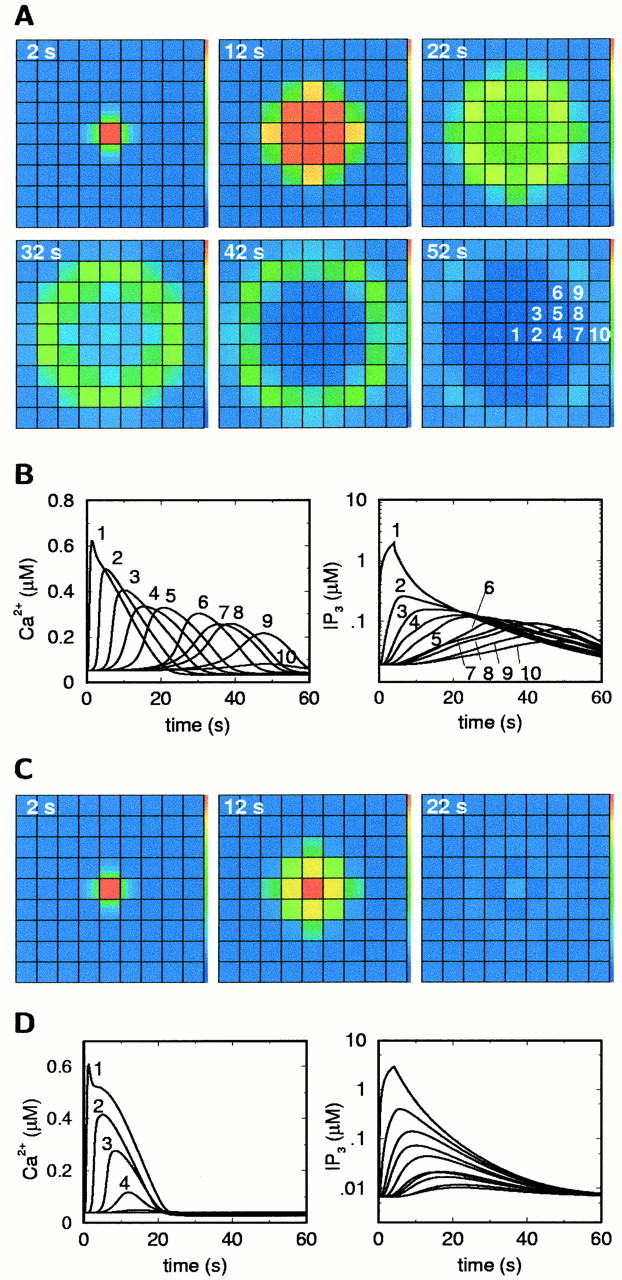
Intercellular Ca2+ waves in the model. A, [Ca2+] isignal for the reference parameter set (Table 1). B, Time courses of [Ca2+]i and IP3 in the cells as labeled in the last frame ofA. C, [Ca2+]i signal in the absence of Ca2+ activation of IP3 production by PLCδ, under otherwise identical conditions. D, Time courses of [Ca2+]i and IP3corresponding to C. The central area of a simulated field of 19 × 19 cells is shown. The stimulus was an elevation of the PLCβ activity v8 in the central cell to 1 μm/sec for 4 sec.
The model allows us to test hypotheses on the propagation mechanism. To discriminate between the roles of intercellular Ca2+ and IP3diffusion, the gap-junctional permeability for Ca2+ was set to zero, and the IP3 permeability was kept at its reference value. This modification has no significant effect on ICW propagation; the wave has practically the same appearance as shown in Figure3A. By contrast, zero IP3 permeability and reference Ca2+ permeability prevents ICW propagation (data not shown). Consequently, the intercellular propagation is based primarily on IP3 diffusion.
A central question is whether the ICWs are mediated solely by IP3 diffusion from the stimulated cell or whether the regeneration of IP3 in downstream cells via PLCδ plays a role. If, under otherwise unchanged conditions, PLCδ activity is set to zero in every cell, the ICW range is greatly reduced: only the immediate neighbors of the stimulated cell respond with a significant [Ca2+]i increase (Fig. 3C,D). Thus in the ICW depicted in Figure 3A, PLCδ acts as a signal amplifier in downstream cells. However, the regeneration of the signal is only partial, so that the ICWs fail after a finite distance, as is usually observed in Ca2+ imaging experiments (Giaume and Venance, 1998).
Regenerative versus diffusive intercellular Ca2+ signals
Such a partial regenerative behavior resulting in spatially limited waves may seem unexpected, given that regenerative phenomena (such as the spread of an action potential along an axon) do not normally exhibit an intrinsic spatial limit to propagation. To analyze this question, we studied the effects of variations in two crucial parameters: the PLCδ activity and the permeability of gap junctions, determining the signal regeneration and intercellular propagation, respectively. Three qualitatively different behaviors are obtained (Fig. 4). If PLCδ activity and gap-junctional coupling are sufficiently large, fully regenerative ICWs are observed. Such waves propagate with constant amplitude and speed over arbitrarily large distances (and correspond to traveling waves in the usual mathematical sense). Conversely, if PLCδ activity is set to very low levels, the intercellular Ca2+signals do not encompass more cells than when the signal is driven solely by IP3 diffusion from the stimulated cell alone. Such signals are thus characterized as diffusion-like in the phase diagram. In between the parameter ranges giving rise to regenerative waves, on the one hand, and purely diffusive signals on the other, there is a region in the phase diagram in which signal regeneration by PLCδ noticeably increases ICW extent beyond the range observed in the diffusive mode, yet the overall range remains finite. The ICW of Figure 3A was calculated for parameters in this region, and we hypothesize that this limited regenerative mode of propagation is operating in cultured striatal astrocytes.
Fig. 4.

Types of intercellular signals in the model as a function of the gap junction permeability for IP3 and the maximal activity of PLCδ. According to the spatial range of propagation, three qualitatively different behaviors are observed: diffusion-like signals, the range of which equals the range obtained by IP3 diffusion from the stimulated cell alone; limited regenerative signals, for which the spatial range is increased by IP3 regeneration yet remains finite; and regenerative waves without an intrinsic limit to their propagation. The + indicates the parameter values used for Figure 3, A andB. All parameters except PIP3and v7 are as in Figure 3. The upper boundary (solid line) is obtained by applying a small stimulus to one cell and evaluating whether it triggers a limited signal or develops into a wave with constant concentration profile. The lower boundary (dashed line) gives the parameter values at which the wave range is increased above the range achieved by pure IP3 diffusion from the stimulated cell, for the same stimulus as in Figure 3.
A difference between the two boundary lines in Figure 4 must be noted. The location of the boundary between the regions of diffusion-like and limited regenerative ICWs (dashed line) depends somewhat on the strength of the initiating stimulus. The line shown is obtained for the stimulus strength used in the simulation of Figure 3. However, the lines for other stimulus strengths were found to lie very close to it. The upper boundary between limited regenerative and fully regenerative ICWs (Fig. 4, solid line) is independent of the stimulus strength (mathematically, it defines the parameters at which traveling wave solutions arise). The experimental data that are available agree with this latter observation to the extent that in cultures showing limited ICWs triggered by receptor agonist also the considerably more potent mechanical stimuli give rise to limited waves (Venance et al., 1997).
Differential control of the Ca2+ wave range by signal regeneration, propagation, and initiation
PLCδ activity
From Figure 4 it is clear that the parameters of signal regeneration and propagation have a decisive impact on the wave range. The wave range obtained on variation of PLCδ activity is shown in Figure 5A. The results were calculated for the same stimulus strength (i.e., PLCδ activity in the stimulated cell) as in Figure 3. Similar results are obtained for different stimulus strengths. The three regions of diffusion-like behavior (v7 < 0.018 μm/sec), limited regenerative ICWs (0.018 μm/sec <v7 < 0.055 μm/sec), and fully regenerative ICWs (v7 > 0.055 μm/sec) are readily recognized.
Fig. 5.

Dependence of ICW range on the model parameters.A, Maximal activity of PLCδ; B, activity of SERCA pump; C, IP3 permeability of the gap junctions; D, comparison of the effects of the three parameters. The reference conditions (0% parameter change) are as for Figure 3, A and B. All parameters that are not shown and the stimulation conditions are as in Figure 3.
Rate of Ca2+ release from the internal stores
Because in downstream cells Ca2+ and IP3 are linked in a positive feedback loop during the upstroke of a Ca2+ signal, parameters influencing the IP3-induced Ca2+ release can be expected to have a similar impact on ICW behavior as PLCδ activity does. This was tested for the Ca2+ load of the ER stores. Increasing the sarco/endoplasmic reticulum calcium ATPase (SERCA) activity k3 results in a higher Ca2+ load of the ER in the rest state and, consequently, in a larger Ca2+discharge under otherwise unchanged activation conditions. This yields an increased range of ICWs (Fig. 5B). Again one observes regions of diffusion-like (k3 < 0.25 sec−1), limited regenerative (0.25 sec−1 <k3 < 0.65 sec−1), and fully regenerative (k3 > 0.65 sec−1) ICW propagation.
Permeability of gap junctions
Increases in the gap-junctional permeability for IP3 also yield increased wave ranges, but the qualitative dependence is different (Fig. 5C). For the reference parameters chosen, even large permeability increases result only in limited regenerative ICWs; a transition to fully regenerative behavior does not take place. The parameter diagram of Figure 4indicates that this is the typical situation, because the region of points for which an increase in the junctional permeability leads to a crossing of the boundary to regenerative waves is comparatively small (the solid border line runs almost parallel to the permeability axis for PIP3 > 1 μm/sec). It is noteworthy that this model prediction agrees with recent experimental results by Rouach et al. (2000), comparing the extent of IWC propagation in astrocytes in the presence and absence of neurons. Significant increases in astrocytic gap junctional communication and in connexin 43 expression (∼50%) were observed in cocultures of astrocytes and neurons compared with pure astrocyte cultures. These were associated with a 30% increase in the number of cells excited by mechanically triggered ICWs.
Figure 5D provides a quantitative comparison of the effects of PLCδ activity, SERCA activity, and IP3permeability on wave range. The reference point (0% parameter change) corresponds to the simulation of Figure 3A. This normalized plot shows that the wave range depends more strongly on the activities of the two enzymes than on the IP3permeability.
Strength of agonist stimulus
Within the regions of partially regenerative and diffusion-like ICWs, the stimulus strength is a crucial determinant of the spatial range of an ICW: larger stimuli yield larger ranges of propagation (Fig. 6). The sensitivity of the wave range toward the stimulus strength, as measured by the slope of curves in Figure 6, increases with PLCδ activity and thus with the partial regeneration of the signal. In the experiments, different stimulus strengths were naturally supplied by various receptor agonists (such as ET-1, Glu, carbachol, and methoxamine), giving rise to different calcium amplitudes in the stimulated cell. Indeed, the wave range was observed to correlate with the potency of the agonist (Venance et al., 1997). The ranges obtained in the model for limited regenerative ICWs (with PLCδ activities between 0.03 and 0.045 μm/sec) are in agreement with the experimental data.
Fig. 6.

Dependence of ICW range on the strength of the stimulus, as measured by the PLCβ rate in the stimulated cell.
Preferential pathways for ICWs
Although the model results agree well with salient experimental observations, they differ in a crucial respect of potential physiological relevance (see Discussion). Agonist-evoked ICWs in astrocyte cultures are considerably more irregular and follow preferential pathways (Finkbeiner, 1992; Venance et al., 1997; Giaume and Venance, 1998). Because of the symmetry of the model assumptions, such irregularity cannot be seen in the simulations. Thus we asked what kind of heterogeneity, if introduced in the model, results in preferential pathways for ICWs. Some irregularity of wave propagation must stem from the fact that cells do not form regular arrays. However, ICWs can appear as rather regular concentric waves, particularly if astrocytes are stimulated strongly by mechanical means (Venance et al., 1997; Giaume and Venance, 1998). This observation indicates that preferential pathways seen after focal agonist application are not governed solely by cell arrangement. In the following, we pursue the idea that variations in parameters between cells, i.e., in the expression levels of enzymes and/or connexins, may play a role. To elucidate the impact of such cellular heterogeneity, random variations of key parameters involved in the regeneration and propagation steps—the PLCδ activity, the SERCA activity, and the gap junctional permeability—are considered. To identify their individual effects, one parameter is distributed heterogeneously across the cells, whereas all others are kept at the same value in all cells.
For the distribution of PLCδ activity among the individual cells in astrocyte populations, no data are currently available. Simulations were performed with random variation of the PLCδ rate constant within the range resulting in limited regenerative ICWs (as given in Fig.5A) and log-normal distribution functions. For such variations, ICW propagation remained practically concentric. Similarly, random heterogeneity in the SERCA rate constant within the range yielding limited regenerative ICWs (Fig. 5B) did not yield substantial deviation from concentric wave shapes (data not shown).
By contrast, random variations of gap-junctional coupling gave rise to preferential pathways of ICW propagation (Fig.7). To obtain information on the distribution of the gap-junctional permeability in astrocyte cultures from rat striatum, gap-junctional conductance data obtained in a previous study were analyzed (Venance et al., 1995). The data show considerable heterogeneity of coupling (Fig. 7A), with a substantial portion of cell pairs being relatively poorly coupled (>40% of the cells have a conductance of <10% of the maximum value of 40 nS). A smooth cumulative distribution function fitted to these data was used to assign a random permeability value to each cell–cell interface in the model. The appearance of the ICWs in such a cell array is considerably closer to experimental observation, with a typical result depicted in Figure 7B. In this example, the wave propagates more readily in the vertical directions.
Fig. 7.

Effect of heterogeneous distribution of gap junction channels between cells on ICWs. A, Histogram of experimental data from double patch-clamp recordings of gap junction conductance in striatal astrocyte pairs (n = 24) [experiments as described in Venance et al. (1995)].B, ICW obtained for a random distribution of intercellular conductances drawn from the probability distribution obtained as a smooth fit to the data in A.
Thus the model exhibits different effects for random heterogeneity in propagation and regeneration steps. On the one hand, the ICWs obtained with heterogeneous intercellular coupling are consistent with the preferential pathways observed in cell culture. On the other hand, randomness in the parameters of regeneration steps does not have a comparable influence on ICW shape, presumably because differences in IP3 regeneration are averaged to some degree between neighboring cells (provided that the cells are coupled sufficiently strongly). Thus far random heterogeneity was considered; however, the preferential distribution or activation of PLCδ along certain paths could strongly bias wave propagation along such paths in a controlled manner. In model simulations with such defined heterogeneous PLCδ distributions, we were able to obtain such effects (data not shown). Given the regulation of PLCδ activity by various external signals (cf. Rebecchi and Pentyala, 2000), such “regulated pathways” with a high degree of plasticity could be established by the molecular mechanisms considered in the model.
Refractory period
In vivo, astrocytes may be subjected to multiple neurotransmitter stimuli. The response characteristics under such conditions should be especially important in the context of astrocyte–astrocyte and astrocyte–neuron communication. To obtain some insight into this interaction process, double stimulation by agonist application to the same astrocyte was considered in the model. As a measure of the wave range, the number of cells responding to the second stimulus normalized by the number of initial responders is used. Simulations show a slight potentiation of the response when the second stimulus is given up to 30 sec after the first and thereafter show a marked refractory period on the time scale of several minutes (Fig.8A). When the second stimulus was applied to a neighbor of the initially stimulated cell, the refractory behavior was very similar (data not shown), demonstrating that it is caused by the dynamics of the entire field of cells.
Fig. 8.

Refractory period of the ICWs. A, For the parameters and stimulation conditions of Figure 3,A and B, a second stimulus of equal magnitude was applied to the same cell after the time indicated, and the fraction of the wave range compared with the range of the initial signal (44 responding cells) was measured. When the second stimulus was applied within 30 sec after the initial stimulus, a slight potentiation of the response is seen; for longer intervals, the system is refractory. B, Effect of Ca2+ store refilling time and stimulus strength on the refractory period. The reference conditions (0% parameter change) are as for Figure 3,A and B.
To obtain a quantitative measure, we define the refractory time τR by the expression:
| Equation 12 |
where N0 andN(t) denote the number of cells responding to the first stimulus and to a subsequent stimulus given at time tafter the first one, respectively. The definition (Eq. 12) is a convenient way of assigning a “half-life” to a monotonic transition process (Llorens et al., 1999), such as the recovery of full responsiveness of the astrocyte field. Using this formula, the refractory periods obtained under different conditions can be readily compared. In particular, we asked which processes control the value of τR. Inspecting the individual time courses of the model variables, one finds that only the Ca2+ concentration in the ER stores shows a pronounced slow transient on the time scale of several minutes, which is related to the refilling of the stores after the Ca2+ discharge. A store refilling time τS can be computed by an expression analogous to Equation 12 [when N(t) andN0 are replaced by the Ca2+ concentration in the store at timet and at steady state, S(t) andS0, respectively]. Assuming that there is no Ca2+ efflux from the ER other than the leak flux, which holds for most of the recovery phase, one obtains, after some algebra:
| Equation 13 |
For the reference parameter set, there is a good agreement between store refilling time τS and refractory period τR of 4.17 and 4.95 min, respectively (note that identical numerical values are not to be expected because they require an unlikely linear relation between the wave range and the degree of ER store refilling). Moreover, by calculating the refractory period for different refilling times, under otherwise unchanged conditions, a strong positive correlation is obtained (Fig.8B, open circles). By contrast, the strength of the initiating stimulus itself has a comparatively minor influence on the refractory period (Fig. 8B,open diamonds).
DISCUSSION
Mechanistic studies of ICWs in astrocytes have shown that propagation can proceed through two pathways: gap junction channels and a diffusible extracellular signal (for review, see Charles and Giaume, 2002). We took advantage of the dominance of the gap-junctional pathway in rat striatal astrocytes and of the detailed experimental data available for this system to construct a mathematical model specifically for ICW propagation through gap junction channels. However, we will argue below that general conclusions derived from the model may also apply to the extracellular pathway. The model supports the hypothesis that, in astrocytes, IP3 is the major component carrying the signal through gap junctions between cells. IP3 is assumed to be produced in the cell stimulated directly with metabotropic receptor agonist through activation of PLCβ and by a Ca2+-activated mechanism in downstream cells, which do not experience the agonist. Ca2+-induced IP3generation may be caused by PLCδ, which is activated by physiological Ca2+ concentrations. Its preferential expression within the CNS in astrocytes (cf. Rebecchi and Pentyala, 2000) could thus be linked to the role as a local signal enhancer in ICWs. Salient experimental findings are reproduced by the model: the typical amplitudes of the Ca2+ responses in successive cells, the overall magnitude of the wave speed, the control of the speed primarily by the intercellular delays, the spatial range of wave propagation, and the sensitive dependence of this range on the strength of the agonist stimulus. In the model, the distributions of gap junctions in the plasma membrane of a cell and of ER calcium stores were assumed to be spatially uniform. It would be an interesting extension to study the effect of subcellular spatial heterogeneities of these structures as reported e.g., by Paemeleire et al. (2000).
Any mechanism for ICWs based on signal regeneration must be compatible with the observed finite range of signaling in the astrocyte cultures studied so far. The prime example of a regenerative process in the nervous system, the propagation of an action potential along an axon, provides an appropriate point of reference. The hallmark of an action potential is the nondecremental behavior of speed and amplitude: at each node along the axon, the action potential triggers a depolarizing ionic flux sufficient to elicit an action potential at the following node. Therefore, the mechanism of propagation has no intrinsic range limit. In the model presented here, the mechanisms of signal regeneration can result, in a certain parameter region, in an analogous nondecremental, or fully regenerative, type of propagation for ICWs (see Fig. 4). Adjacent to it, there exists a parameter region in which regeneration of the signal occurs, yet the ICW range is limited. Accordingly, we propose the term “limited regenerative signaling” for this mode of ICW propagation. Interestingly, a limited regenerative propagation was also noted for action potentials in particular circumstances, especially when a neuron was stimulated before full recovery of excitability after an action potential (Katz, 1966). Limited regeneration in the model of ICWs can chiefly be understood as follows. The influx of IP3 into a cell through gap junctions initiates a Ca2+ spike, inducing IP3 production. However, IP3 generation is of such a magnitude that the IP3 efflux into the following cells is invariably smaller than the influx. There is thus a decline of IP3 production from the stimulated cell outward, until the signal eventually fails. Interestingly, the model suggests that the gap-junctional IP3 permeability is limiting to propagation only in a rather small region of parameter space [for PIP3 < 1 μm/sec (Fig.4); cf. also analytical results on ICWs in discretely coupled cells (Höfer et al., 2001)] and that the main control over the wave range is exerted by the regenerative steps.
A previous model of ICW propagation from a focal stimulus postulates passive diffusion of IP3 from the stimulated cells as the underlying process (Sneyd et al., 1994, 1995), and there is good experimental evidence that a point source of IP3 can induce ICWs (Braet et al., 2001). This model is essentially obtained when PLCδ activity is set to zero in the present model (Fig. 3C,D). However, crucial properties of the astrocytic ICWs were found in the model only when IP3 regeneration was included: (1) the reproduction of realistic wave ranges of up to 100 cells for realistic Ca2+ amplitudes in the stimulated cell; (2) the sensitivity of the wave range to the stimulus amplitude (again for realistic variations of the Ca2+amplitude as a measure of stimulus strength); and (3) the Ca2+ amplitude plateau and subsequent abrupt failure of propagation that has also been a prominent feature in the experimental data (Venance et al., 1997). These observations argue in favor of a regenerative component in the propagation mechanism.
Experimental findings indicate that regenerative mechanisms could be involved in ICWs also in other astroglial systems. Harris-White et al. (1998) have described self-sustained spiral ICWs in hippocampal slice cultures. Spiral waves are known to be a characteristic pattern of wave propagation in regenerative two-dimensional systems. Indeed, we could obtain spiral ICWs in preliminary simulations of the model when parameter values in the fully regenerative range were chosen (compare Fig. 4). In another study, incubation of astrocyte cultures with glucocorticoids was reported to increase the [Ca2+]i baseline, which resulted in considerably larger ranges of ICWs (Simard et al., 1999). Our model indeed predicts for increased basal [Ca2+]i that both the Ca2+ concentration in the stores and the basal activity of PLCδ rise, and, accordingly, a larger ICW range is obtained [in the experimental paper by Simard et al. (1999), involvement of ATP secretion is invoked, but this may follow a similar mechanism; see below].
These observations raise the question regarding to what extent the conclusions of our model can be generalized. It has been reported that calcium elevation alone does not generate ICWs in astrocytes, thus arguing against a calcium-activated component in IP3 production (Leybaert et al., 1998). However, in the striatal system, ICWs can be evoked by focal stimulation of calcium influx through ionomycin, which per se increases the rate of IP3 production (Venance et al., 1997). Thus the mechanism proposed in the model could be differentially expressed in various glial systems. ICW propagation via the extracellular pathway involves altogether different molecular mechanisms, including ATP release (Cotrina et al., 1998; Guthrie et al., 1999; Scemes et al., 2000) independent of calcium (Wang et al., 2000). Recent studies have also indicated regeneration of ATP during ICW propagation (Newman, 2001; Schipke et al., 2002). In this case, the principle of limited regenerative ICWs may apply to the extracellular pathway too. ATP in the extracellular pathway would then play a role analogous to IP3 in the gap-junctional pathway. Because ATP acts on metabotropic receptors, its putative regeneration would be expected to include the regeneration of IP3. This may provide a mechanism for the interaction of the gap-junctional and extracellular pathways.
In the context of the integration of astrocytic calcium signaling with other signaling processes in the CNS, besides its spatial properties its temporal characteristics are also relevant. Calcium spikes with a duration of seconds are considerably slower than action potentials. Moreover, the model predicts that a yet longer time scale, on the order of minutes, is introduced by the refractory period. Because the rate of ER Ca2+ store refilling turns out to be an important determinant of the refractory period, processes that act on store Ca2+ dynamics are potential modulators of the refractory period. These model predictions are open to experimental testing. Moreover, it can be hypothesized that differences from cell to cell in refractory behavior also contribute to the observed heterogeneity of cellular Ca2+ responses with respect to single spikes versus oscillations (Finkbeiner, 1992; Blomstrand et al., 1999).
The restricted range of ICWs could imply that information coded by Ca2+ changes in astrocytes has a specific field of interaction with neurons. In neuronal populations, selectivity of synaptic connections and synaptic efficacy are key elements in the drawing of neuronal networks. In astrocytic networks, the topographic patterns caused by gap junctional communication are less clear. Indeed, dye injection in various brain structures (cortex, hippocampus, striatum) indicates that passive diffusion occurs according to the concentric zone of coupling without any respect to frontiers of brain structures and compartmentalization (Konietzko and Muller, 1994;D'Ambrosio et al., 1998; Hamon et al., 1999). However, “geographic” properties and plasticity in astrocytic networks may not be determined by passive diffusion but could instead be caused by variations in other parameters affecting ICW propagation, most notably those involved in signal regeneration. In the model, the activities of PLCδ and SERCA are such determinants of signal regeneration. Thus the control of these processes may introduce selectivity in information processing by glial cells. Secondarily, astrocytic networks drawn by ICWs could also selectively affect neuronal networks, because close interaction occurs at synaptic contacts through the recently described tripartite synaptic constellation (Araque et al., 1999; Haydon, 2001).
Footnotes
Support from the Procope program (Deutscher Akademischer Austanschdienst/Égide) is gratefully acknowledged. T.H. thanks the members of the Neuropharmacology laboratory at the Collège de France for their hospitality and stimulating discussions.
Correspondence should be addressed to Dr. T. Höfer, Theoretische Biophysik, Institut für Biologie, Humboldt-Universität Berlin, Invalidenstrasse 42, D-10115 Berlin, Germany. E-mail:thomas.hoefer@rz.hu-berlin.de.
REFERENCES
- 1.Araque A, Parpura V, Sanzgiri RP, Haydon PG. Tripartite synapses: glia, the unacknowledged partner. Trends Neurosci. 1999;22:208–215. doi: 10.1016/s0166-2236(98)01349-6. [DOI] [PubMed] [Google Scholar]
- 2.Atri A, Ammundson J, Clapham D, Sneyd J. A single-pool model for intracellular calcium oscillations and waves in the Xenopus laevis oocyte. Biophys J. 1993;65:1727–1739. doi: 10.1016/S0006-3495(93)81191-3. [DOI] [PMC free article] [PubMed] [Google Scholar]
- 3.Bezprozvanny I, Watras J, Ehrlich BE. Bell-shaped calcium response curves of Ins(1, 4, 5)P3 and calcium gated channels from endoplasmic reticulum of the cerebellum. Nature. 1991;351:751–754. doi: 10.1038/351751a0. [DOI] [PubMed] [Google Scholar]
- 4.Blomstrand F, Giaume C, Hansson E, Ronnback L. Distinct pharmacological properties of ET-1 and ET-3 on astroglial gap junctions and Ca2+ signaling. Am J Physiol. 1999;277:C616–627. doi: 10.1152/ajpcell.1999.277.4.C616. [DOI] [PubMed] [Google Scholar]
- 5.Braet K, Paemeleire K, D'Herde K, Sanderson MJ, Leybaert L. Astrocyte-endothelial cell calcium signals conveyed by two signalling pathways. Eur J Neurosci. 2001;13:79–91. [PubMed] [Google Scholar]
- 6. Charles AC, Giaume C. Intercellular calcium waves in astrocytes: underlying mechanisms and functional significance. Tripartite synapses: synaptic transmission with glia Volterra A, Magistretti P, Haydon P. 2002. Oxford UP; Oxford, in press. [Google Scholar]
- 7.Cornell-Bell AH, Finkbeiner SM, Cooper MS, Smith SJ. Glutamate induces calcium waves in cultured astrocytes: long-range glial signaling. Science. 1990;247:470–473. doi: 10.1126/science.1967852. [DOI] [PubMed] [Google Scholar]
- 8.Cotrina ML, Lin JHC, Alves-Rodrigues A, Liu S, Li J, Azmi-Ghadimi H, Kang J, Naus CCG, Nedergaard M. Connexins regulate calcium signaling by controlling ATP release. Proc Natl Acad Sci USA. 1998;95:15735–15740. doi: 10.1073/pnas.95.26.15735. [DOI] [PMC free article] [PubMed] [Google Scholar]
- 9.D'Ambrosio R, Wenzel J, Schwartzkroin PA, McKhann GM, Janigro D. Functional specialization and topographic segregation of hippocampal astrocytes. J Neurosci. 1998;18:4425–4438. doi: 10.1523/JNEUROSCI.18-12-04425.1998. [DOI] [PMC free article] [PubMed] [Google Scholar]
- 10.Dani JW, Chernjavsky A, Smith SJ. Neuronal activity triggers calcium waves in hippocampal astrocyte networks. Neuron. 1992;8:429–440. doi: 10.1016/0896-6273(92)90271-e. [DOI] [PubMed] [Google Scholar]
- 11.Dupont G, Goldbeter A. One-pool model for Ca2+ oscillations involving Ca2+ and inositol 1, 4, 5-trisphosphate as co-agonist for Ca2+ release. Cell Calcium. 1993;14:311–322. doi: 10.1016/0143-4160(93)90052-8. [DOI] [PubMed] [Google Scholar]
- 12.Dupont G, Tordjmann T, Clair C, Swillens S, Claret M, Combettes L. Mechanism of receptor-oriented intercellular calcium wave propagation in hepatocytes. FASEB J. 2000a;14:279–289. doi: 10.1096/fasebj.14.2.279. [DOI] [PubMed] [Google Scholar]
- 13.Dupont G, Swillens S, Clair C, Tordjmann T, Combettes L. Hierarchical organization of calcium signals in hepatocytes: from experiments to models. Biochim Biophys Acta. 2000b;1498:134–152. doi: 10.1016/s0167-4889(00)00090-2. [DOI] [PubMed] [Google Scholar]
- 14.Eckert R, Adams B, Kistler J, Donaldson P. Quantitative determination of gap junctional permeability in the lens cortex. J Membr Biol. 1999;169:91–102. doi: 10.1007/s002329900521. [DOI] [PubMed] [Google Scholar]
- 15.Finkbeiner S. Calcium waves in astrocytes: filling the gaps. Neuron. 1992;8:1101–1108. doi: 10.1016/0896-6273(92)90131-v. [DOI] [PubMed] [Google Scholar]
- 16.Giaume C, Venance L. Intercellular calcium signaling and gap junctional communication in astrocyes. Glia. 1998;24:50–64. [PubMed] [Google Scholar]
- 17.Guthrie PB, Knappenberger J, Segal M, Bennett MVL, Charles AC, Kater SB. ATP released from astrocytes mediates glial calcium waves. J Neurosci. 1999;19:520–528. doi: 10.1523/JNEUROSCI.19-02-00520.1999. [DOI] [PMC free article] [PubMed] [Google Scholar]
- 18.Hamon B, Glowinski J, Giaume C. Intercellular diffusional coupling between glial cells in slices from the striatum. In: De Vellis, editor. Neuroglia in the aging brain. Humana; New York: 1999. pp. 94–133. [Google Scholar]
- 19.Harris-White ME, Zanotti SA, Frautschy SA, Charles AC. Spiral intercellular calcium waves in hippocampal slice cultures. J Neurophysiol. 1998;79:1045–1052. doi: 10.1152/jn.1998.79.2.1045. [DOI] [PubMed] [Google Scholar]
- 20.Hassinger TD, Guthrie PB, Atkinson PB, Bennett MVL, Kater SB. An extracellular signaling component in propagation of astrocytic calcium waves. Proc Natl Acad Sci USA. 1996;93:13268–13273. doi: 10.1073/pnas.93.23.13268. [DOI] [PMC free article] [PubMed] [Google Scholar]
- 21.Haydon PG. Glia: Listening and talking to the synapse. Nat Rev Neurosci. 2001;2:185–193. doi: 10.1038/35058528. [DOI] [PubMed] [Google Scholar]
- 22.Höfer T. Model of intercellular calcium oscillations in hepatocytes: synchronization of heterogeneous cells. Biophys J. 1999;77:1244–1256. doi: 10.1016/S0006-3495(99)76976-6. [DOI] [PMC free article] [PubMed] [Google Scholar]
- 23.Höfer T, Politi A, Heinrich R. Intercellular Ca2+ wave propagation through gap-junctional Ca2+ diffusion: a theoretical study. Biophys J. 2001;80:75–87. doi: 10.1016/S0006-3495(01)75996-6. [DOI] [PMC free article] [PubMed] [Google Scholar]
- 24.Katz B. Nerve, muscle and synapse. McGraw-Hill; New York: 1966. [Google Scholar]
- 25.Konietzko U, Muller CM. Astrocytic dye coupling in rat hippocampus: topography, developmental onset, and modulation by protein kinase C. Hippocampus. 1994;4:297–306. doi: 10.1002/hipo.450040313. [DOI] [PubMed] [Google Scholar]
- 26.Leybaert L, Paemeleire K, Strahonja A, Sanderson MJ. Inositol-trisphosphate-dependent intercellular calcium signaling in and between astrocytes and endothelial cells. Glia. 1998;24:398–407. [PubMed] [Google Scholar]
- 27.Llorens M, Nuno JC, Rodriguez Y, Melendez-Hevia E, Montero F. Generalization of the theory of transition times in metabolic pathways: a geometrical approach. Biophys J. 1999;77:23–36. doi: 10.1016/S0006-3495(99)76869-4. [DOI] [PMC free article] [PubMed] [Google Scholar]
- 28.Morton KM, Mayers DF. Numerical solution of partial differential equations. Cambridge UP; Cambridge: 1993. [Google Scholar]
- 29.Newman EA. Propagation of intercellular calcium waves in retinal astrocytes and Müller cells. J Neurosci. 2001;21:2215–2223. doi: 10.1523/JNEUROSCI.21-07-02215.2001. [DOI] [PMC free article] [PubMed] [Google Scholar]
- 30.Newman EA, Zahs KR. Calcium waves in retinal glial cells. Science. 1997;275:844–847. doi: 10.1126/science.275.5301.844. [DOI] [PMC free article] [PubMed] [Google Scholar]
- 31.Paemeleire K, Martin PE, Coleman SL, Fogarty KE, Carrington WA, Leybaert L, Tuft RA, Evans WH, Sanderson MJ. Intercellular calcium waves in HeLa cells expressing GFP-labeled connexin 43, 32, or 26. Mol Biol Cell. 2000;11:1815–1827. doi: 10.1091/mbc.11.5.1815. [DOI] [PMC free article] [PubMed] [Google Scholar]
- 32.Pawelczyk T, Matecki A. Structural requirements of phospholipase C delta 1 for regulation by spermine, sphingosine and sphingomyelin. Eur J Biochem. 1997;248:459–465. doi: 10.1111/j.1432-1033.1997.00459.x. [DOI] [PubMed] [Google Scholar]
- 33.Rebecchi MJ, Pentyala SN. Structure, function, and control of phosphoinositide-specific phospholipase C. Physiol Rev. 2000;80:1291–1335. doi: 10.1152/physrev.2000.80.4.1291. [DOI] [PubMed] [Google Scholar]
- 34.Robb-Gaspers LD, Thomas AP. Coordination of Ca2+ signaling by intercellular Ca2+ wave propagation in the intact liver. J Biol Chem. 1995;270:8102–8107. doi: 10.1074/jbc.270.14.8102. [DOI] [PubMed] [Google Scholar]
- 35.Rouach N, Glowinski J, Giaume C. Activity-dependent neuronal control of gap-junctional communication in astrocytes. J Cell Biol. 2000;149:1513–1526. doi: 10.1083/jcb.149.7.1513. [DOI] [PMC free article] [PubMed] [Google Scholar]
- 36.Sanderson MJ. Intercellular calcium waves mediated by inositol trisphosphate. CIBA Found Symp. 1995;188:175–189. [PubMed] [Google Scholar]
- 37.Sanderson MJ, Charles AC, Dirksen ER. Mechanical stimulation and intercellular communication increases intracellular calcium in epithelial cells. Cell Regul. 1990;1:585–596. doi: 10.1091/mbc.1.8.585. [DOI] [PMC free article] [PubMed] [Google Scholar]
- 38.Schipke CG, Boucsein C, Ohlemeyer C, Kettenmann H. Astrocyte Ca2+ waves trigger responses in microglial cells in brain slices. FASEB J. 2002;16:255–257. doi: 10.1096/fj.01-0514fje. [DOI] [PubMed] [Google Scholar]
- 39.Scemes E, Suadicani SO, Spray DC. Intercellular communication in spinal cord astrocytes: fine tuning between gap junctions and P2 nucleotide receptors in calcium wave propagation. J Neurosci. 2000;20:1435–1445. doi: 10.1523/JNEUROSCI.20-04-01435.2000. [DOI] [PMC free article] [PubMed] [Google Scholar]
- 40.Simard M, Couldwell WT, Zhang W, Song H, Liu SJ, Cotrina ML, Goldman S, Nedergaard M. Glucocorticoids: potent modulators of astrocytic calcium signaling. Glia. 1999;28:1–12. doi: 10.1002/(sici)1098-1136(199910)28:1<1::aid-glia1>3.0.co;2-4. [DOI] [PubMed] [Google Scholar]
- 41.Sneyd J, Charles AC, Sanderson MJ. A model for the propagation of intercellular calcium waves. Am J Physiol. 1994;266:C293–C302. doi: 10.1152/ajpcell.1994.266.1.C293. [DOI] [PubMed] [Google Scholar]
- 42.Sneyd J, Wetton BTR, Charles AC, Sanderson MJ. Intercellular calcium waves mediated by diffusion of inositol trisphosphate: a 2-dimensional model. Am J Physiol. 1995;268:C1537–C1545. doi: 10.1152/ajpcell.1995.268.6.C1537. [DOI] [PubMed] [Google Scholar]
- 43.Tang YH, Stephenson JL, Othmer HG. Simplification and analysis of models of calcium dynamics based on IP3-sensitive calcium channel kinetics. Biophys J. 1996;70:246–263. doi: 10.1016/S0006-3495(96)79567-X. [DOI] [PMC free article] [PubMed] [Google Scholar]
- 44.Venance L, Piomelli D, Glowinski J, Giaume C. Inhibition by anandamide of gap junctions and intercellular calcium signalling in striatal astrocytes. Nature. 1995;376:590–594. doi: 10.1038/376590a0. [DOI] [PubMed] [Google Scholar]
- 45.Venance L, Stella N, Glowinski J, Giaume C. Mechanism involved in initiation and propagation of receptor-induced intercellular calcium signaling in cultured rat astrocytes. J Neurosci. 1997;17:1981–1992. doi: 10.1523/JNEUROSCI.17-06-01981.1997. [DOI] [PMC free article] [PubMed] [Google Scholar]
- 46.Venance L, Premont J, Glowinski J, Giaume C. Gap junctional communication and pharmacological heterogeneity in astrocytes cultured from the rat striatum. J Physiol (Lond) 1998;510:429–440. doi: 10.1111/j.1469-7793.1998.429bk.x. [DOI] [PMC free article] [PubMed] [Google Scholar]
- 47.Verkhratsky A, Orkand RK, Kettenmann H. Glial calcium: homeostasis and signaling function. Physiol Rev. 1998;78:99–141. doi: 10.1152/physrev.1998.78.1.99. [DOI] [PubMed] [Google Scholar]
- 48.Verselis V, White RL, Spray DC, Bennett MLV. Gap junctional conductance and permeability are linearly related. Science. 1986;234:461–464. doi: 10.1126/science.3489990. [DOI] [PubMed] [Google Scholar]
- 49.Wagner J, Keizer J. Effects of rapid buffers on Ca2+ diffusion and Ca2+ oscillations. Biophys J. 1994;67:447–456. doi: 10.1016/S0006-3495(94)80500-4. [DOI] [PMC free article] [PubMed] [Google Scholar]
- 50.Wang ZQ, Haydon PG, Yeung ES. Direct observation of calcium-independent intercellular ATP signaling in astrocytes. Anal Chem. 2000;72:2001–2007. doi: 10.1021/ac9912146. [DOI] [PubMed] [Google Scholar]