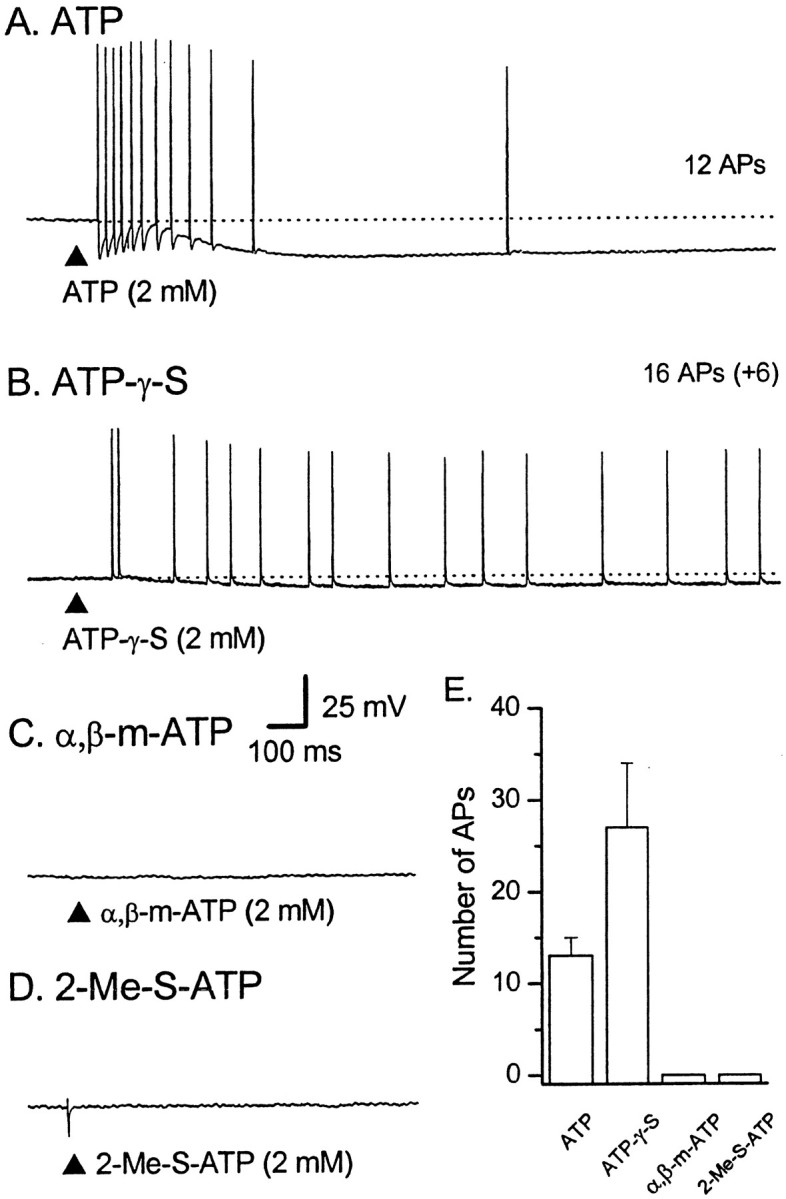
Fig. 2.

Responses in AH–sensory neurons to mucosal application of ATP, ATP-γ-S, α,β-me-ATP or 2-Me-S-ATP. Representative voltage traces from four different AH neurons during application of ATP or ATP analogs to the mucosa; dotted lines indicate RMP. Calibration in Capplies to all traces. The total number of APs is shown to the right of each trace.A, Brief application (100 msec; at the filled triangle) of ATP (2 mm) elicited a train of APs that showed a slowing in frequency during the 1.1 sec duration of the discharge; the average instantaneous frequency (ƒINT) was 29 Hz [resting membrane potential (RMP) of −67 mV]. B, ATP-γ-S (2 mm) elicited a 3.0-sec-long train of 22 APs (16 APs shown) that fired at a slow, relatively constant frequency (fINT of 12 Hz; RMP of −82 mV).C, α,β-methylene ATP (2 mm) failed to elicited any APs in the majority of cases (RMP of −68 mV).D, 2-Me-S-ATP (2 mm) also failed to elicit any APs under control conditions (n = 3).E, Histogram showing the average number of APs evoked by agonists for two to three repetitions per cell. ATP,n = 18; ATP-γ-S, n = 7; α,β-methylene ATP, n = 7; 2-Me-S-ATP,n = 3.
