
Fig. 1.
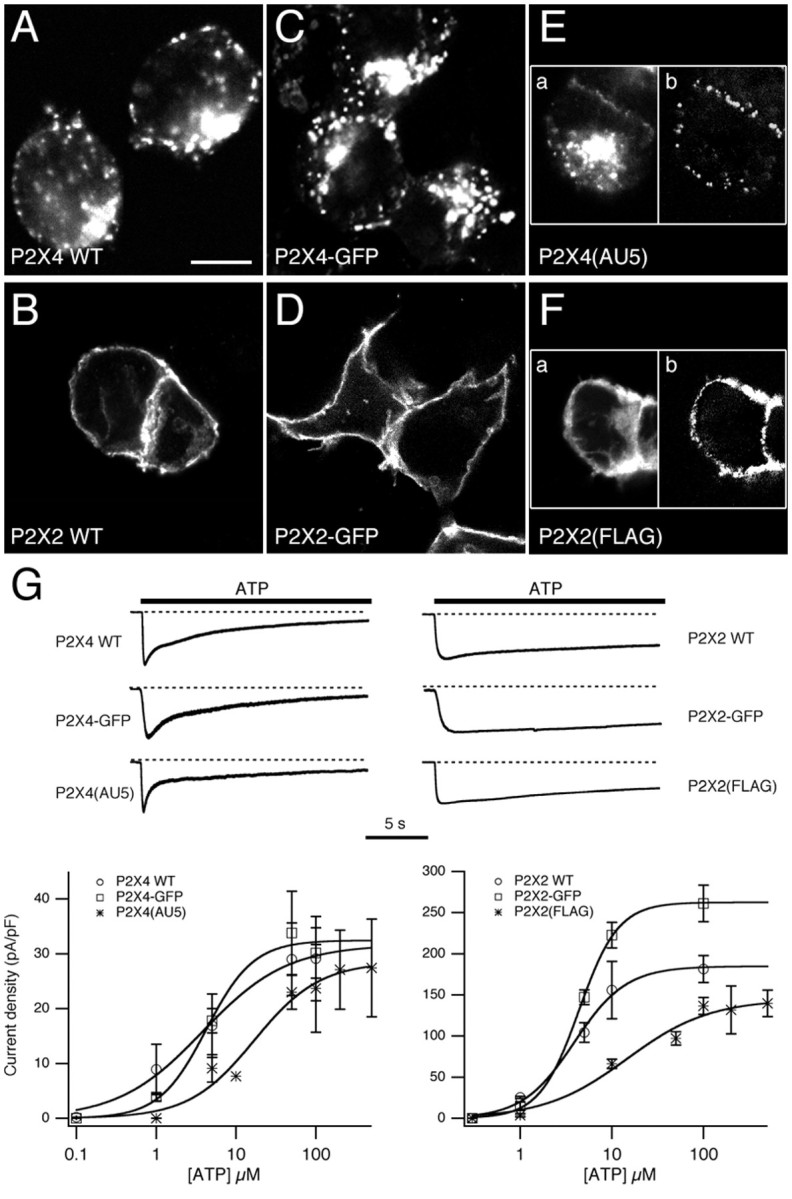
Subcellular distribution and functional properties of P2X constructs in HEK293 cells. A–F, The subcellular distribution of P2X4 WT (A), P2X4–GFP (C), P2X4(AU5) (E), P2X2 WT (B), P2X2-GFP (D), and P2X2(FLAG) (F) receptors in HEK293 cells. Cells expressing untagged receptors were stained using anti-P2X4/Cy3 or anti-P2X2/Cy3. Cells expressing P2X4(AU5) were stained using anti-AU5/Cy3 before (E, left panel) and anti-P2X4/FITC after permeabilization. Cells expressing P2X2(FLAG) were stained using anti-FLAG/Cy3 before (F, left panel) and anti-P2X2/FITC after permeabilization. Scale bar, 10 μm. G, Concentration–effect curves for ATP and representative traces showing ATP-evoked whole-cell currents for P2X4 (left) and P2X2 (right) constructs used in this study. ATP-evoked peak currents shown are normalized to compare the time course of desensitization. Calculated EC50values were 3.8, 4.2, and 17 μm for P2X4 WT, P2X4–GFP, and P2X4(AU5), respectively. Calculated EC50 values for P2X2 WT, P2X2–GFP, and P2X2(FLAG) were 3.9, 4.4, and 14.6 μm, respectively (n = 3–7 cells for each concentration).