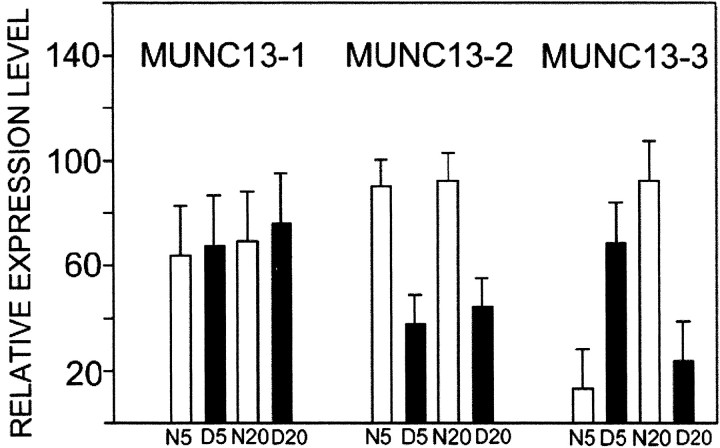
Fig. 5.
Differential regulation of Munc13 family member expression by age and dark rearing. Histograms showing relative levels of expression of Munc13-1, Munc13-2, and Munc13-3 in visual cortex of N5, D5, N20, and D20 cat visual cortex (n = 3 at each age and rearing condition). The relative intensity of signals in Northern blots was determined by densitometric scanning. In each blot, Munc13 signals were normalized against GAPDH mRNA and expressed as a percentage of the maximal corrected signal for that blot. Results from the three animals in each group were averaged. Error bars indicate mean and SEM.

