
Fig. 11.
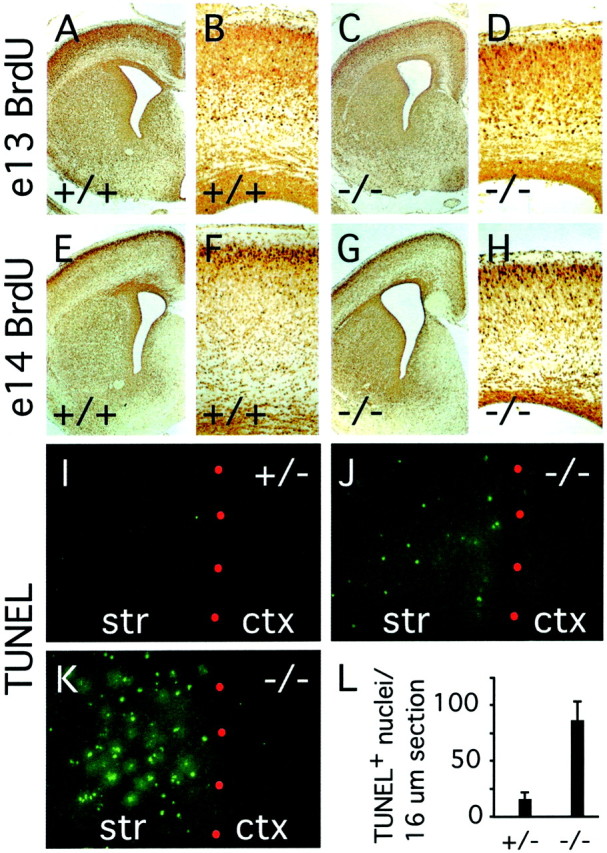
Cortical migration and striatal cell death infz3(−/−) brains at E18. A–H, BrdU labeling at E13 (A–D) or E14 (E–H); animals were killed at E18. The density of striatal neurons and the density and layering pattern of cortical neurons are similar between fz3(+/−) andfz3(−/−) brains. The fz3(−/−) cortex shows a thinning of the genu of the corpus callosum and the subventricular zone. I–L, TUNEL-labeled cells in 16 μm sections of striatum and cortex at E18. Red dots, The border between the striatum (str) and cortex (ctx). I, J, Typical appearance of fz3(−/−) and fz3(+/−)sections; K, a fz3(−/−) section with an unusually high density of TUNEL-positive cells. L, Mean and SDs of TUNEL-positive cells per 16 μm section of striatum at E18, counted from fz3(+/−) (n = 24 sections) or fz3(−/−) (n = 28 sections) brains.