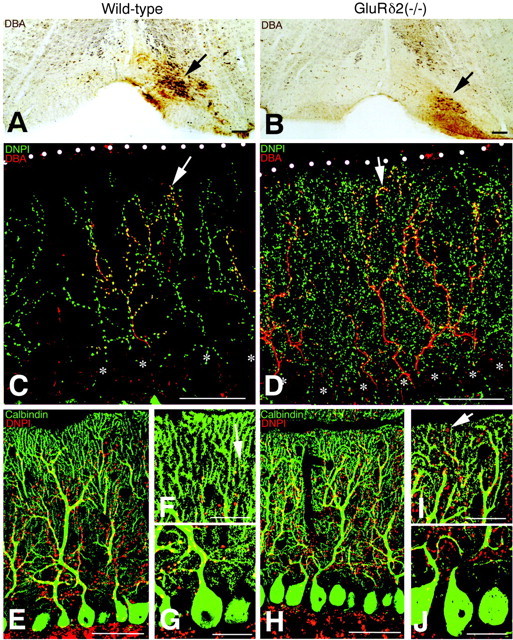
Fig. 1.

CF labeling in the wild-type (A, C, E–G) and GluRδ2 knock-out (B, D, H–J) mice. A, B, Injection site and extent (arrows) of biotinylated dextran amine (BDA) in the inferior olivary nucleus. C, D, Double fluorescence for BDA-labeled CFs (red) and vesicular glutamate transporter DNPI (green). Arrowsindicate the tips of BDA-labeled CFs. White dots andasterisks indicate the pial surface of the cerebellum or PC somata, respectively. Note an expanded distribution of both BDA- and DNPI-labeled CFs in the knock-out molecular layer. Also note a marked increase of DNPI-immunolabeled puncta in the knock-out molecular layer.E–J, Double immunofluorescence for DNPI (red) and calbindin (green).F, I, and G, J, Closer views of the superficial and deep portions of the molecular layer shown inE and H, respectively.Arrows indicate the most superficial puncta immunostained for DNPI. Scale bars: A, B, 100 μm;C–E, H, 50 μm; F, G, I, J, 20 μm.
