Fig. 3.

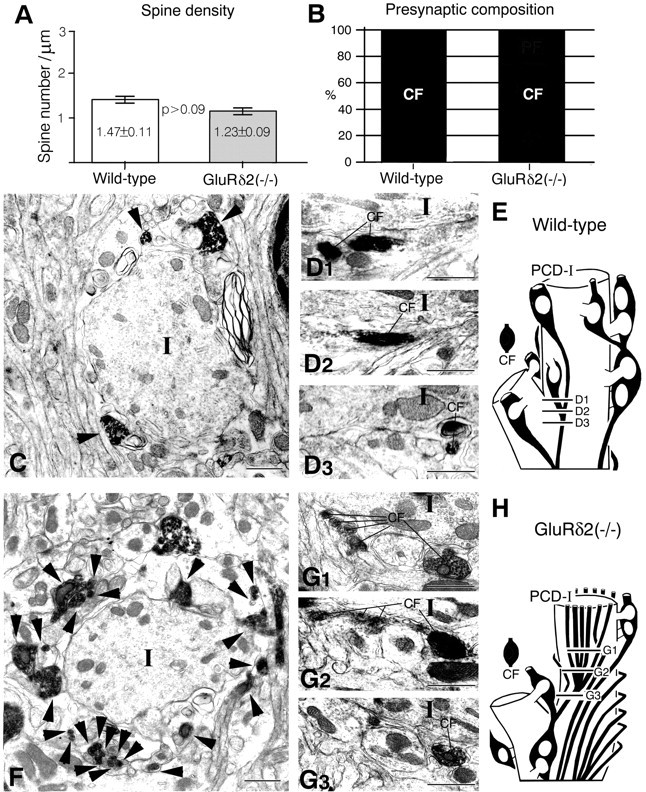
PCD-I (proximal) domain. A, Spine density. Vertical bars indicate the mean spine number/1 μm of dendritic length (mean ± SEM). The spine density is obtained from serial electron micrographs. B, Presynaptic composition on PC spines. C–E, Wild type.F–H, Knock-out. C, F, Cross-section images at 10 μm above the initial branching point of CFs. InC and F, note a marked increase of CF profiles (arrowheads) around PCD-I dendrite (I) in the knock-out. Single CFs usually divide into two branches in the wild-type (D1–D3), whereas four or more branches are produced in the knock-out (G1–G3). E, H, Reconstructed images of a part of the PCD-I domain. Approximate positions of electron micrographsD1–D3 and G1–G3 are indicated in the reconstructed images. Scale bars, 1 μm.
