
Fig. 7.
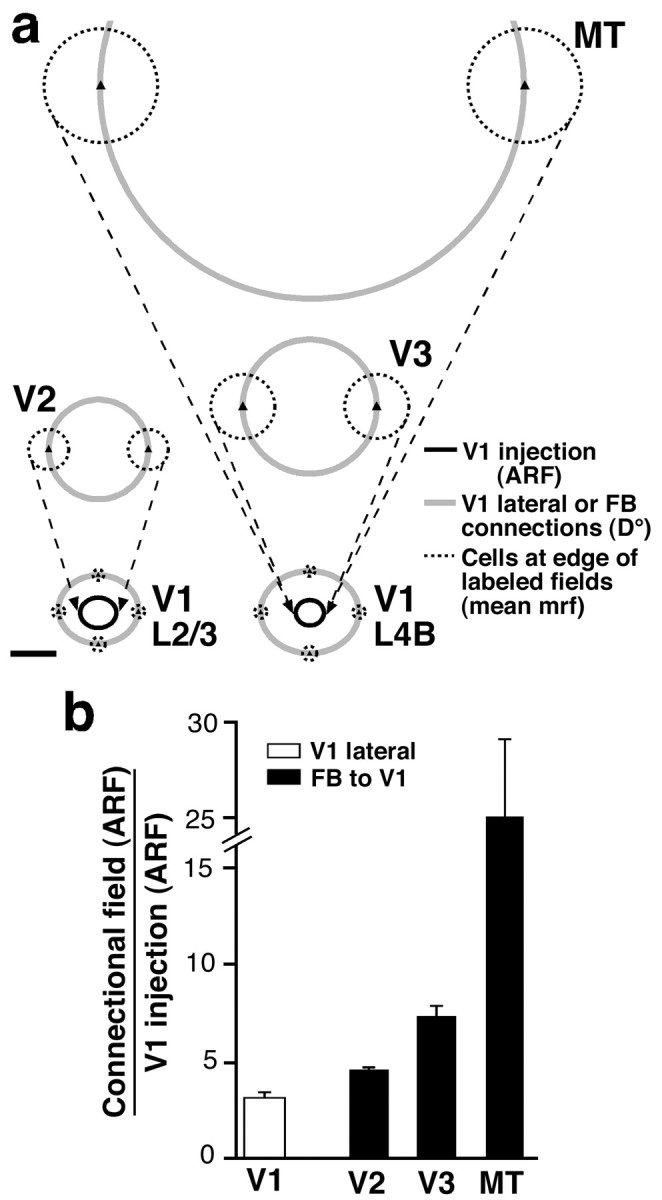
Visuotopic extent of retrogradely labeled fields of cells of origin of FB connections in extrastriate cortex.a, Visual field map of FB fields of neurons in layers 5/6 of areas V2 (top left), V3 (middle right), and MT (top right) labeled by a CTB injection through V1 layers 1–4C at 6.5° eccentricity (same injection case as in Fig. 6a). Visual field maps of V1 lateral connections in layers 2/3 (bottom left) and 4B (bottom right) labeled by the same V1 injection are also shown. Gray circles, D° of the connectional fields. Black ovals, aggregate mrf size of neurons at the V1 injection site (1.3 × 1.6° in layers 2/3; 1.1 × 1.2° in layer 4B). Dashed black circles, mean mrf size of cells at the edge of labeled fields. The aggregate mrf size of each connectional field is the sum of the diameter of thegray circle plus the diameter of one dashed black circle. This was estimated as described in Materials and Methods and measured 3.5 × 4.1° (V1 layers 2/3 horizontal connections), 4.1 × 4.8° (V1 layer 4B horizontal connections), 6.1° (V2 FB), 8.7° (V3 FB), and 23.6° (MT FB). The aggregate mrf of retrogradely labeled neuronal FB fields in the upper layers of extrastriate cortex (data not shown) measured 5.4° (V2), 7.6° (V3), and 15.3° (MT). Scale bar, 2°. b, Histogram of the population means of the relative visuotopic extent of labeled layer 5/6 FB fields (black bars) in areas V2 (n = 6), V3 (n = 5), and MT (n = 2), arising from the same V1 tracer injections. The visuotopic extent is expressed as the ratio of the aggregate mrf size of the FB field along its long axis to the aggregate mrf size of neurons at the V1 injection site. White bar, Mean aggregate mrf ratio (3.3 ± 0.24) for V1 lateral connections (n = 21). Note cut on they-axis scale.