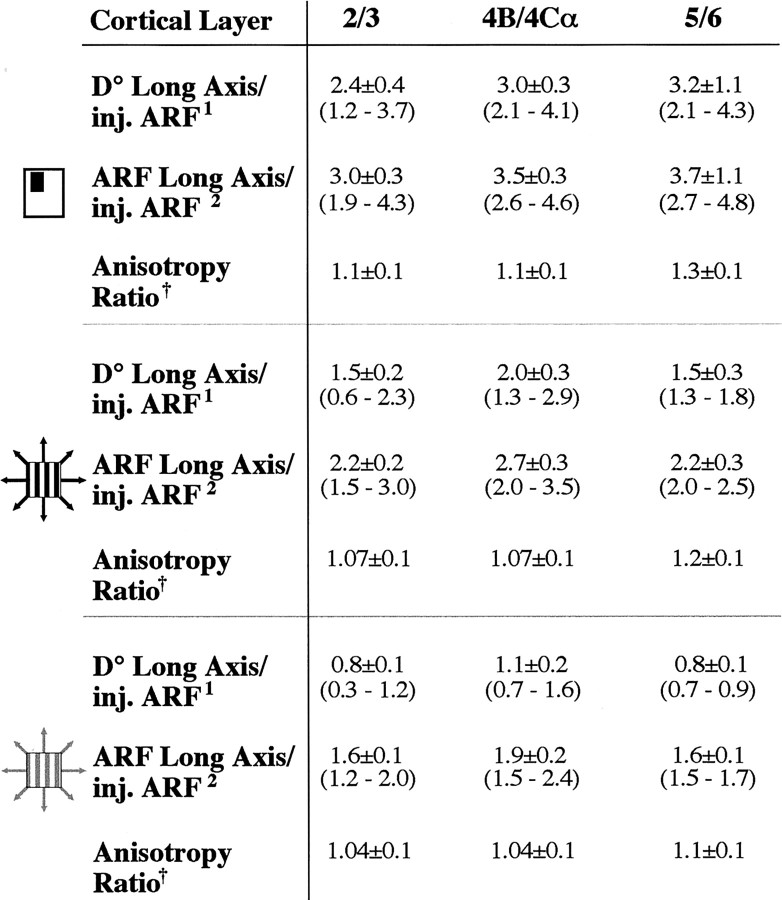
Table 2.
Visual field extent and anisotropy of V1 lateral connections
Ratios are shown for ARFs computed using three different measures of RF size (symbols on the left; as in Fig.2c). All values are mean ± SEM. Values in parenthesis are minimum and maximum; n, same as in Table 1, V1 lateral.
D° along the labeled field's long axis/ARF size of the injection site.
ARF size along the labeled field's long axis/ARF size of the injection site.
ARF size along long axis/ARF size along short axis of labeled field.

