
Fig. 1.
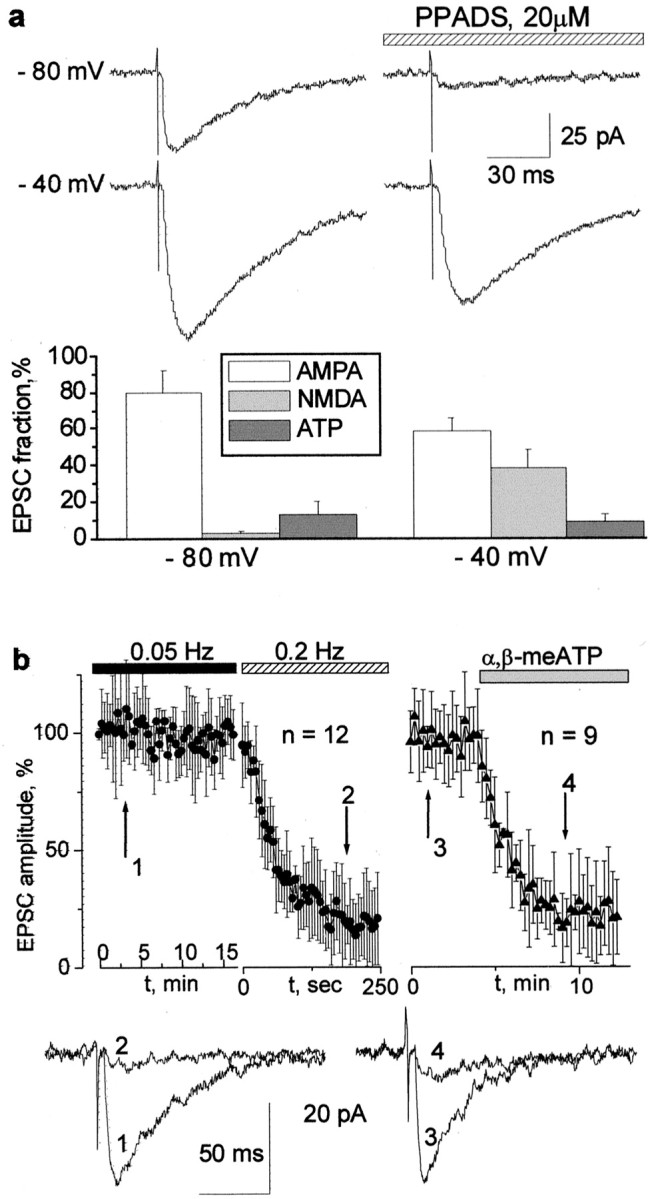
Purinergic synaptic input in hippocampal CA1 neurons. a, EPSCs elicited by stimulation of the Schaffer collaterals. The current was measured at two membrane voltages always in the presence of NBQX (10 μm). Right column, Application of PPADS (20 μm) on the background of NBQX. Each trace is the average of five consecutive responses. Note that, at a holding potential of −80 mV, the EPSC consists almost entirely of P2X-mediated current.Bottom diagrams demonstrate the relative contribution of the AMPA, NMDA, and ATP receptor-mediated currents to the total EPSC. Each column represents the mean ± SD for 15 cells.b, The desensitization of the ATP-mediated EPSC, measured in the presence of NBQX (10 μm) andd-APV (50 μm) at a holding voltage of −75 mV. The top left graph demonstrates that the amplitude of the purinergic component of the EPSC in CA1 neurons is stable when the frequency of stimulation is 0.05 Hz but quickly fades when the frequency is increased to 0.2 Hz. The top right graphdemonstrates the disappearance of the purinergic component of the EPSC after bath application of 20 μm α,β-meATP, a nonhydrolyzable analog of ATP, with stimulation frequency of 0.05 Hz. The representative current traces obtained at the times indicated by the arrows are demonstrated below the graphs.