
Fig. 3.
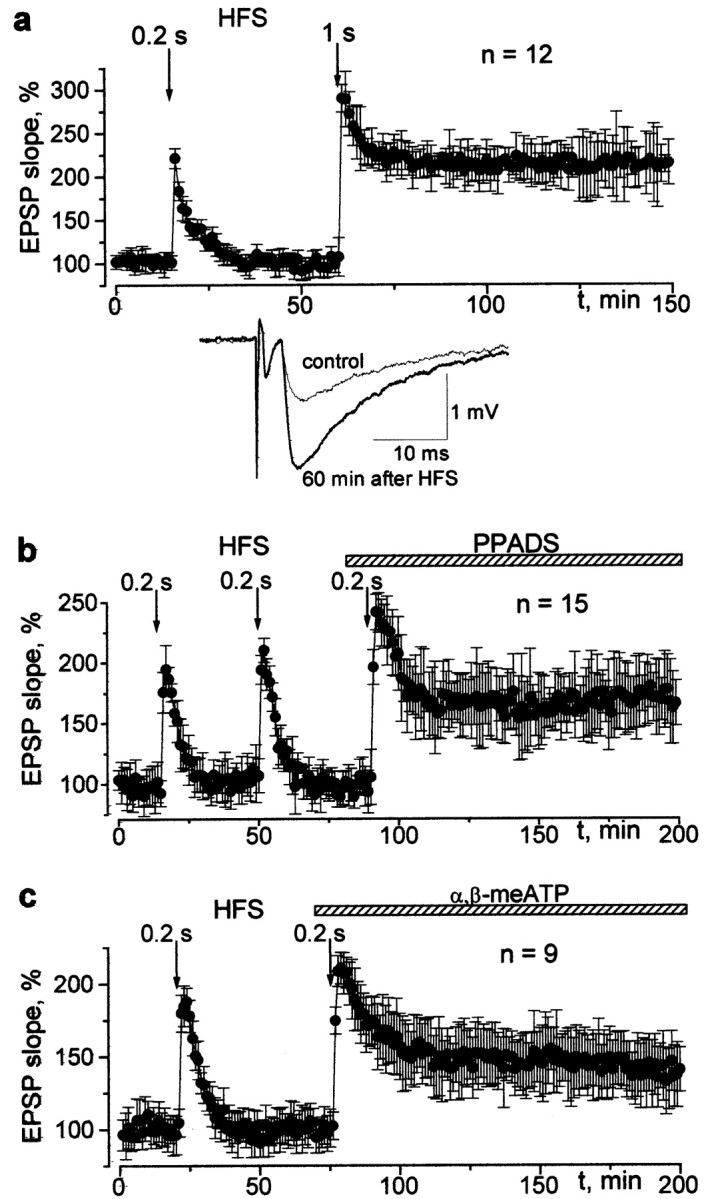
The changes in the CA1 field potentials induced by 100 Hz stimulation delivered to the Schaffer collateral in the control and after inhibition of the ATP receptors. a, The time course of the potentiation evoked by 0.2 and 1 sec of 100 Hz stimulation trains in control conditions. Examples of field EPSPs recorded before and 60 min after the 1-sec-long HFS train are indicated in the inset. Each trace represents the average of 10 EPSPs. b, c, The time course and magnitude of the potentiation evoked by the 0.2 sec HFS train in control and after bath application of 20 μmPPADS and α,β-methyleneATP, respectively. Baseline stimulation frequency is 0.08 Hz.