
Fig. 3.
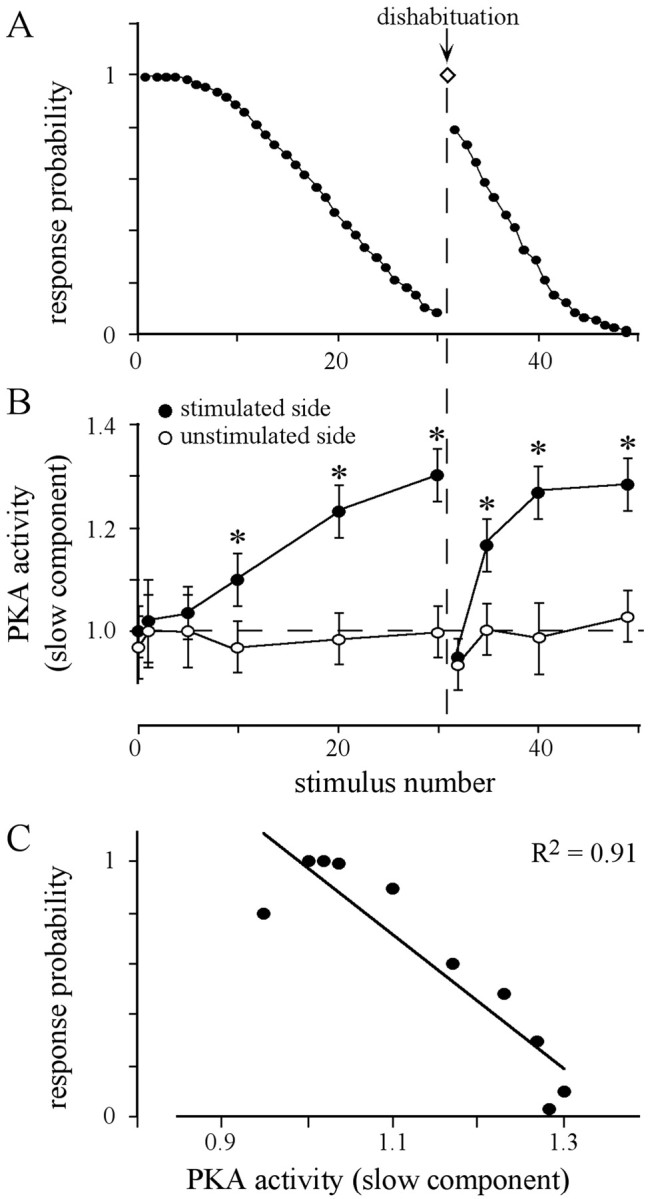
Dishabituation by an appetitive stimulus and PKA activity in the AL. A, Animals received 30 sucrose stimuli (ISI, 2 sec) to one antenna, followed by a dishabituating stimuli applied to the contralateral antenna (arrow), and a second session of repetitive sucrose stimulations to the previously stimulated antenna. The values represent the average of the response probability of 15 animals. B, The slow component of PKA activity in both antennal lobes was determined 5 sec after the stimulus number indicated. Values were normalized to PKA activity in unstimulated animals, which are defined as the relative PKA activity of 1 (dashed lines). Each data point represents the mean ± SEM of the PKA activity of at least seven measurements (ANOVA: stimulated side, p< 0.0001; unstimulated side, p = 0.88; *p < 0.008, paired t test, stimulated vs unstimulated side). C, The slow component of PKA activity determined in the stimulated AL (data fromB) is highly correlated with the corresponding response probability (data from A).