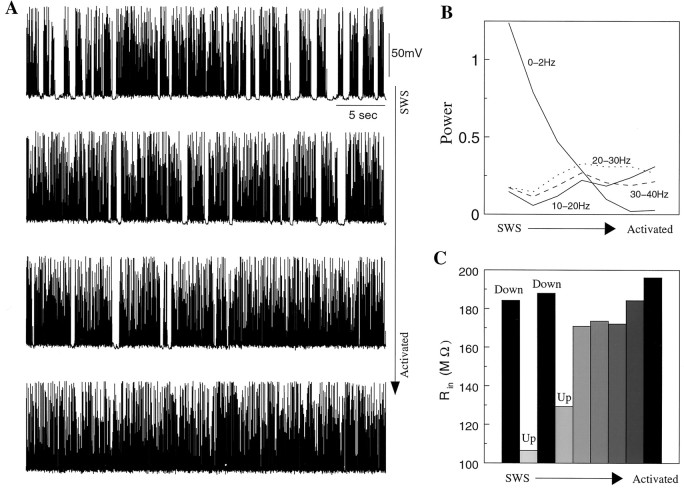
Fig. 9.
Transition from SWS oscillation to activated state in the thalamocortical network model. A, Decrease of the maximal conductances for potassium leak current in PY and TC cells and synaptic conductance between PY neurons eliminated silent phases in the cortical network activity. The firing became persistent and its frequency stabilized at ∼17 Hz. SWS state:gPY−PY = 0.15 μS, gRE−TC = 0.2 μS,gTC−RE = 0.4 μS, gKL = 0.3 μS/cm2; activated state:gPY−PY = 0.08 μS, gRE−TC = 0.1 μS,gTC−RE = 0.2 μS, gKL = 0. B, Integrated power in different frequency bands (as indicated in this figure) during transition to activated state. C, The input resistance of PY cells increased from ∼110 MΩ (during up phases of SWS oscillations) to ∼190 MΩ (during activated state), thus reaching the level of the input resistance during silent (Down) phases of SWS.

