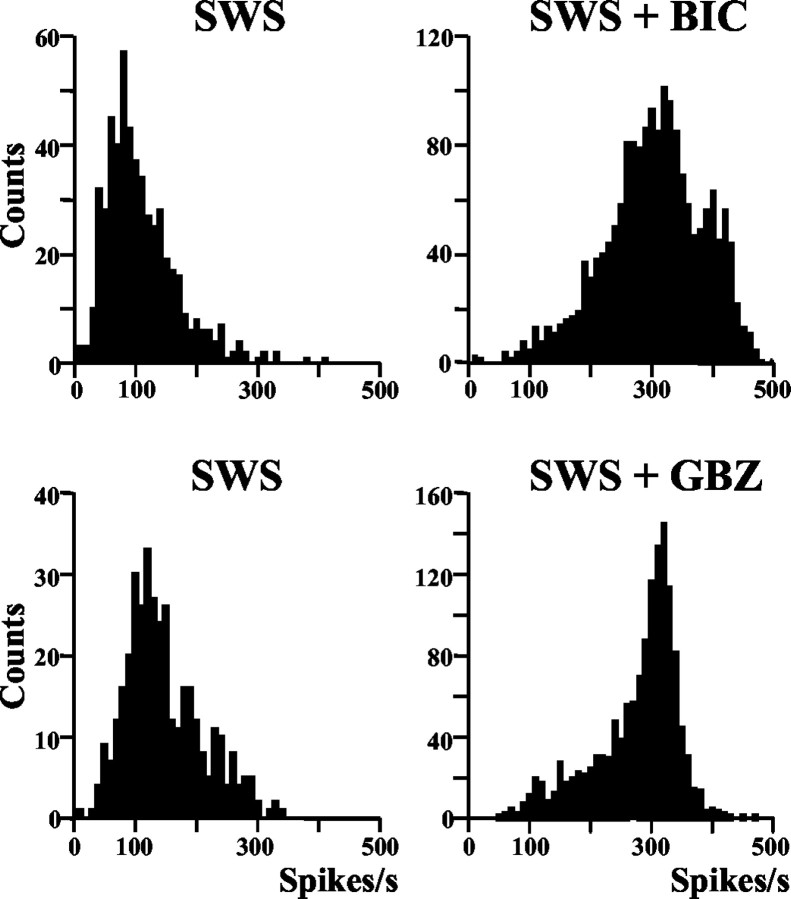
Fig. 6.
Histograms of the mean frequencies within all bursts of 2 groups of STN neurons (n = 17,top; n = 6, bottom) recorded both in control SWS (left column; 526 and 369 bursts, respectively) and during iontophoresis of the GABAAantagonists in SWS (right column; bicuculline,SWS + BIC, 1767 bursts; gabazine, SWS + GBZ, 1359 bursts). Note that, for both groups, mean frequencies within bursts were distributed at ∼100 Hz in typical SWS, whereas they were significantly increased during the same vigilance state to ∼300 Hz by both GABAA antagonists. Note also the shoulder on the right of the SWS + BIC histogramreflecting the somewhat higher frequencies within bicuculline-induced bursts compared with the gabazine-induced ones.

