
Fig. 8.
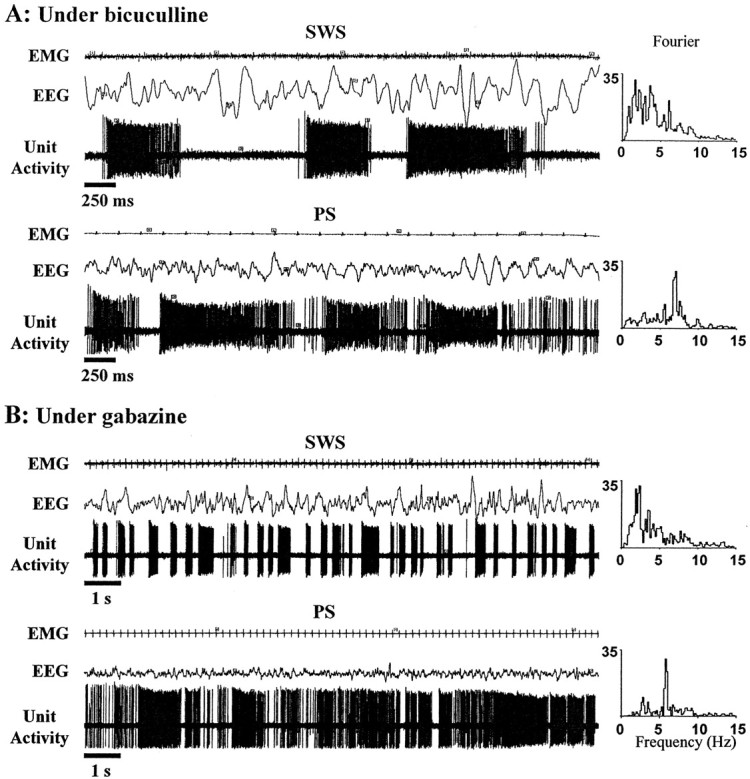
Illustration of changes in the STN neuronal discharge between SWS and PS episodes under ongoing iontophoresis of bicuculline (A) or gabazine (B). Raw traces of polygraphic recordings (EEG, EMG) and single-unit activity of two STN neurons are represented together with the Fourier spectra (relative power in the 0–15 Hz band) of the corresponding EEGs on theright. These periodograms typically illustrate the high-voltage slow waves in the delta range during SWS and the power highly concentrated in the theta band (5.5–8.5 Hz) during PS.A, The clear-cut bicuculline-induced bursts recorded on this STN neuron during SWS were replaced by a mixed pattern during a spontaneous PS episode. Single spike random activity was superimposed on strong bursts. The expanded time scale (250 msec) was chosen to permit the visual appreciation of single random spikes between bursts during PS. B, Same observations for another STN neuron recorded under ongoing gabazine iontophoresis during SWS and PS. Note that for B, the time scale (1 sec) is different from the one in A to illustrate the sustained high-frequency firing that can be observed within PS episodes.