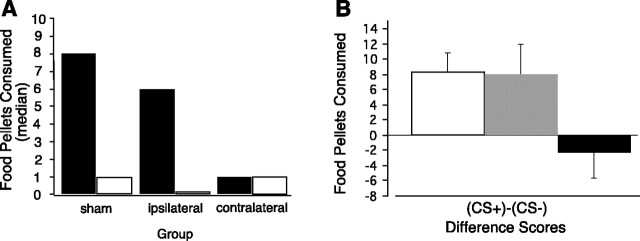
Fig. 3.
Food consumption tests.A, Food consumption of sham, ipsilateral, and contralateral rats during the potentiated eating tests. Black bars show food consumption during the tests with CS+, andwhite bars show consumption during the tests with CS−.B, Mean difference between the consumption during the tests with CS+ and consumption during the tests with CS− presentations. Consumption of sham, ipsilateral, and contralateral rats is shown with white, gray, andblack bars, respectively. The error bars indicate the SEM.

