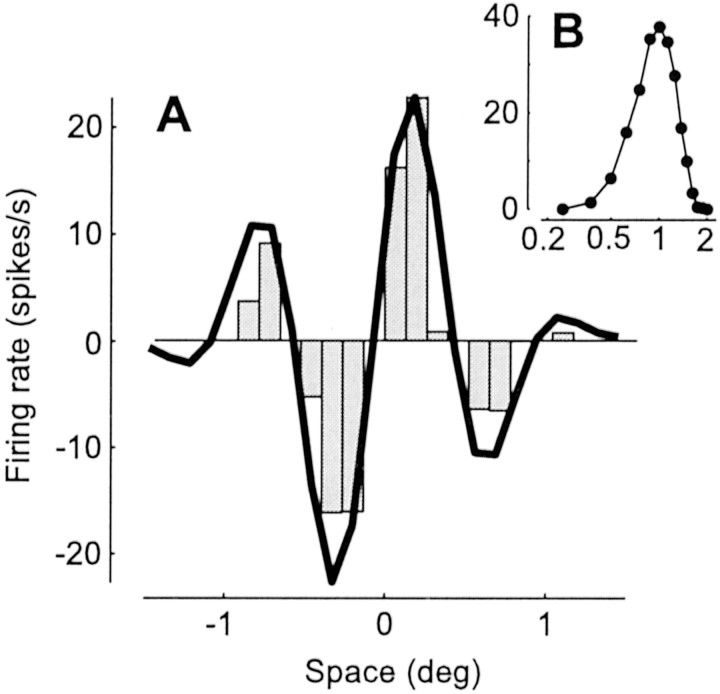
Fig. 10.
Linearity of spatial summation; simulation of the experiment by Movshon et al. (1978a). A, One-dimensional receptive field profile of the model neuron. The histogram shows responses to a stationary full-contrast vertical bar (width, 0.25°; duration, 100 msec); positive (negative) values are responses to a bright (dark) bar, as a function of bar position. A curve indicates a prediction of receptive field profile based on responses to drifting gratings under the assumption of linearity.B, Spatial frequency selectivity of the neuron measured with 4 Hz drifting gratings. The abscissa indicates spatial frequency in cycles per degree, and the ordinate indicates mean firing rate in spikes per second. The curve in Awas derived from these data and arbitrarily rescaled, as by Movshon et al. (1978a).

