
Fig. 6.
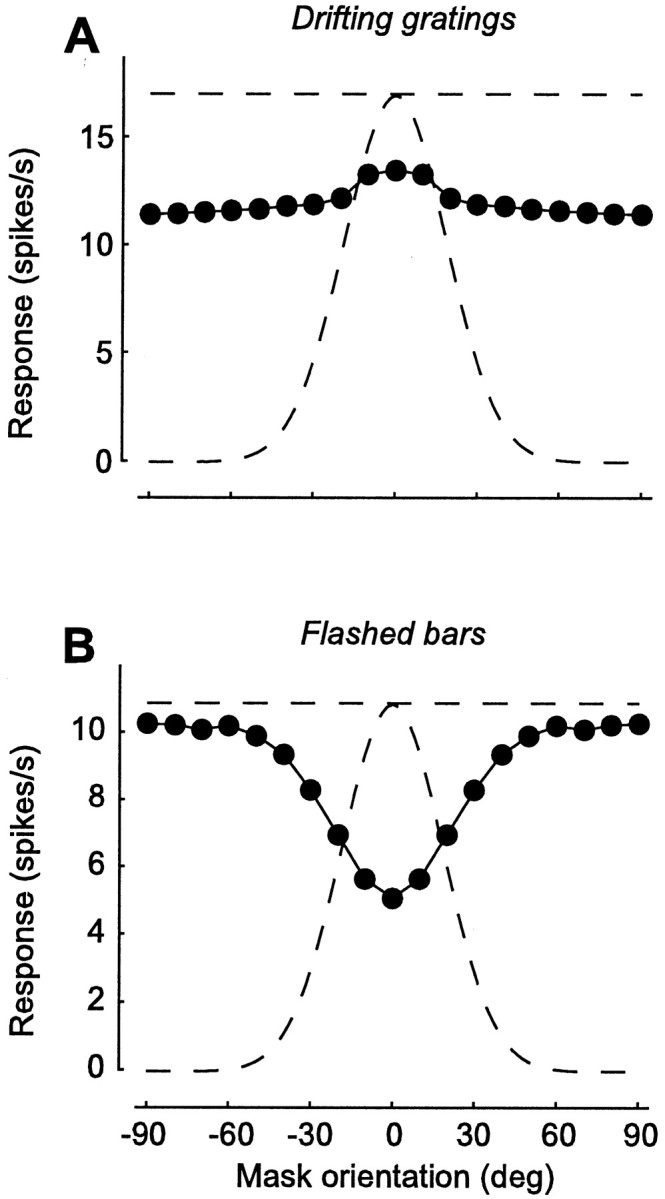
Orientation dependence of suppression by drifting and flashed masks. Responses to an optimally oriented test as a function of mask orientation. For comparison, the curved dashed line shows responses to tests of different orientations, in the absence of a mask. The straight dashed line is the response to optimal orientation. A, Suppression by superimposed drifting gratings. This is a simulation of an experiment by Bonds (1989). Responses are computed by fitting to the firing rate a sinusoid with the temporal frequency of the test grating (4 Hz). Gratings (20% contrast) were presented for 1 sec. Mask grating drifted at 3 Hz and was superimposed to the test. B, Suppression by a mask flashed bar preceding a test flashed bar. This is a simulation of an experiment by Nelson (1991a). Responses are computed by taking the mean firing rate during presentation of a test bar. Bars had maximal intensity on a mean gray background and were flashed for 100 msec; mask preceded test by 50 msec.