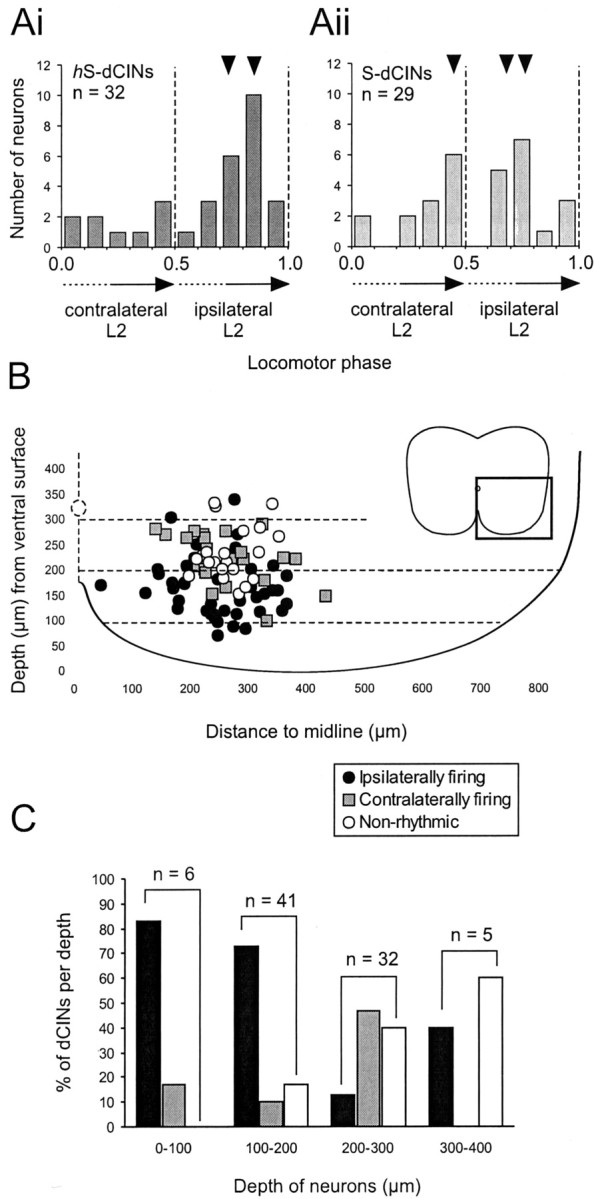
Fig. 4.

Rhythmic dCIN populations with distinct ventral-dorsal locations exhibit differing phase relationships.A, Plot of dCIN circular statistic vectors over a locomotor cycle showing the distribution preferred phases of firing in rhythmic dCINs (hS-dCINs, Ai; S-dCINs,Aii). The small black arrowheads above the histograms indicate the bins containing most dCINs for each group. The dashed lines indicate the approximate transition points from contralateral bursts (cL2) to ipsilateral burst (iL2) (0.5) and from iL2 to cL2 (1.0).B, distribution of contralaterally firing (gray squares), ipsilaterally firing (black circles), and nonrhythmic (white circles) dCINs in the transverse plane of the lumbar spinal cord (the area magnified as shown in the inset).C, Histogram of the percentage of each cell type at a given depth (color coding as for B).Numbers shown above the bar graphsindicate the size of the sample at each depth. Memb., Membrane.
