Fig. 5.

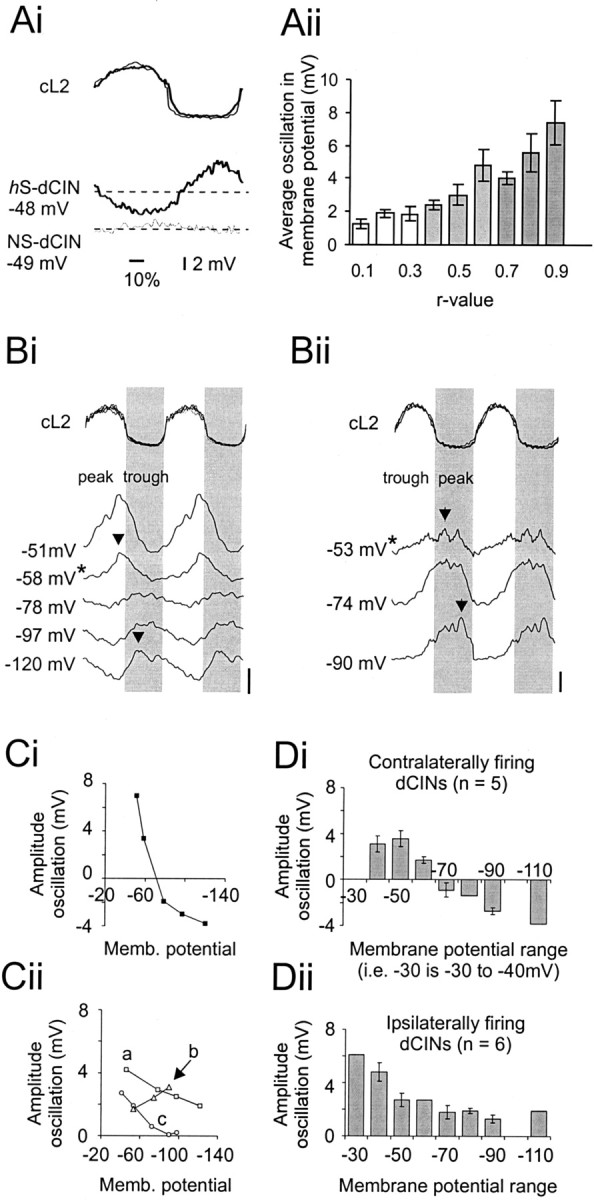
Locomotor-related membrane oscillations of dCINs reflect synaptic input. Ai, Averaged membrane oscillation of an hS-dCIN (bold line,bottom traces) and NS-dCIN (thin line,bottom traces) with respect to the normalized and rectified cL2 cycle (top panel).Aii, Relationship between r value and average membrane oscillation (at 0 bias for a minimum of 20 cL2 cycles;n = 77). B, Membrane oscillations at different holding potentials for two different dCINs (Bi,Bii). Top traces show the normalized cL2 cycle, with the gray areacorresponding to the ipsilateral L2 phase. Lower tracesshow the averaged, 10 Hz filtered intracellular recordings for 2 dCINs. Zero bias is indicated by the asterisk next to the membrane potential. The peak is indicated by the arrows.Bi, Neuron in which the phase of the peak reverses when hyperpolarized beyond the reversal potential for Cl−. Bii, Cell with increased oscillation amplitudes at more hyperpolarized levels.Ci, Plot (black squares) of relative amplitude of the peak–trough oscillation at varying membrane potentials for the example shown in Bi. Note the sign reversal when the cell is hyperpolarized. Cii, Example of three dCINs driven predominantly by excitation: a, mixed AMPA and NMDA components (squares);b, mainly AMPA-driven (triangles); c,mainly NMDA-driven (circles). D, Distribution of average membrane oscillation for different membrane potential (in bins of 10 mV) ranges in neurons that are driven predominantly by inhibition and firing in-phase with the contralateral root (Di) and dCINs that receive phasic excitatory input and are firing in-phase with the ipsilateral root (Dii).
