Fig. 6.

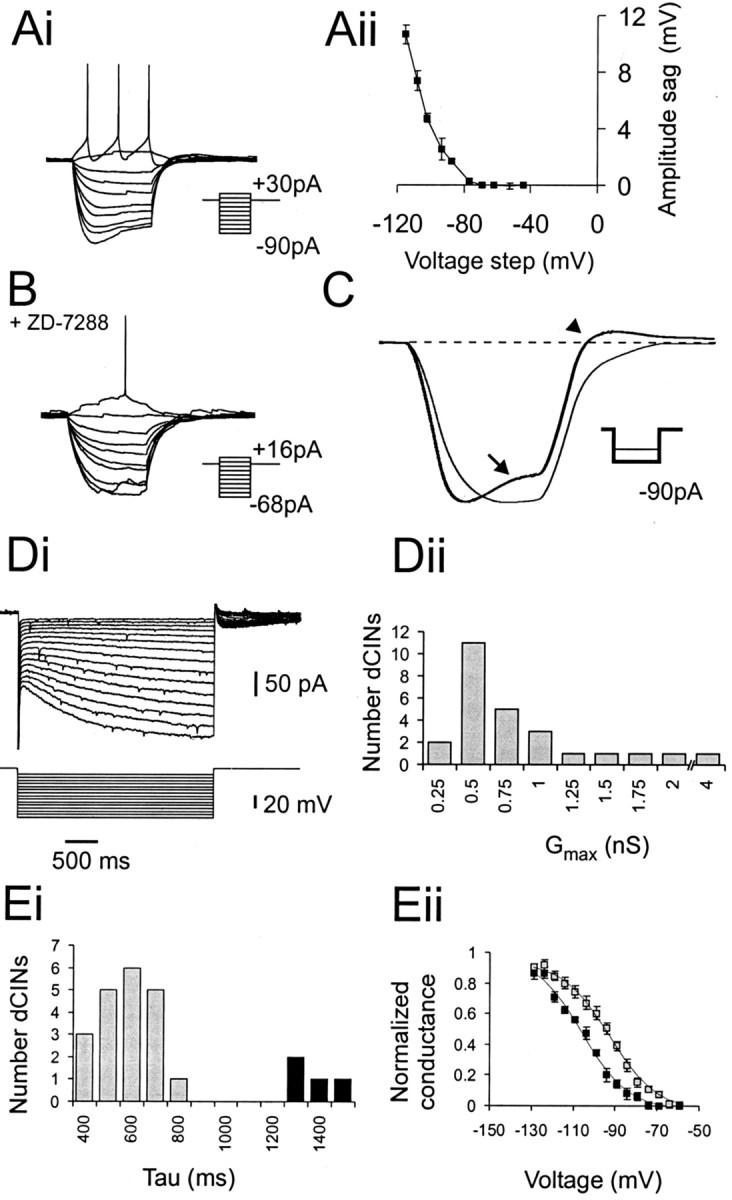
Characteristics of the dCINIh. A, Intracellular recording from S-dCINs showing a voltage sag (Ai) in response to current injection and a depolarizing rebound after termination of the current pulse. Data of the averageIh-induced sag amplitude ± SE from three control I–V trials are shown inAii. B, Effect of 20 min incubation with 50 μm ZD 7288. Note the decrease in size of the injected current steps. C, Effect of ZD 7288 shown by comparison of averaged data for three runs at the most hyperpolarized step (control, bold line; ZD 7288,thin line). The control sag is indicated by thearrow, and the rebound depolarization is indicated by the arrowhead. Di, Activation ofIh measured under voltage-clamp conditions. Five millivolt steps were applied between −60 and −130 mV from a holding potential of −50 mV. Dii, Distribution of Gmax (maximal conductance) for 24 dCINs.Ei, Analysis of τ Act revealed two discrete populations in the sample: short τ Act(gray) and longer (black) τAct dCINs. The plot shows voltage versus normalized conductance for the both populations of τAct, same color code as forEi. Note that the dCINs with longer τActhave their activation curves shifted to a more hyperpolarized level than those with short τAct.
