
Fig. 2.
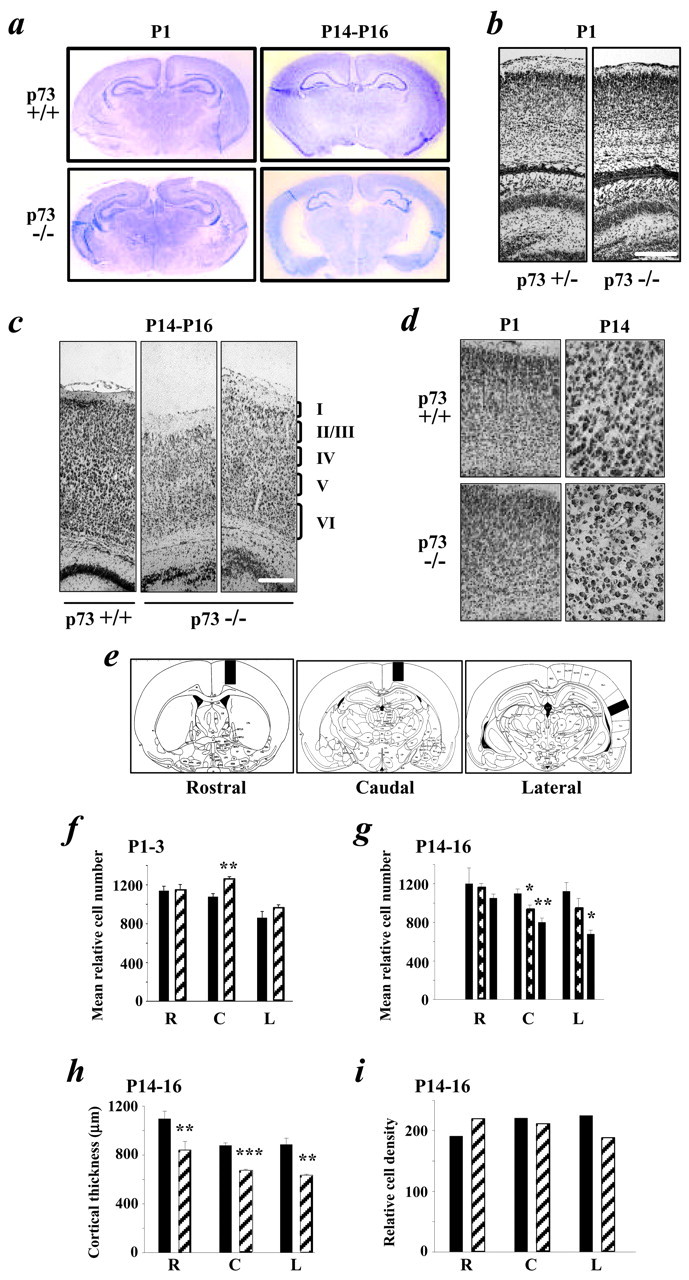
Absence of p73 leads to a loss of cortical neurons during the first 2 postnatal weeks. a, Photographs of coronal forebrain sections of P1–P3 and P14–P16 p73+/+ and p73−/− mice stained with cresyl violet. b,c, Photomicrographs of p73+/+ or p73+/− versus p73−/− Nissl-stained coronal sections of the cortex at P1 (b) and P14–P16 (c). The cortical layers are denoted on the right ofc. Scale bars: b, 200 μm;c, 150 μm. d, Higher magnification photomicrographs of Nissl-stained coronal sections showing that, at P1–P3, the gross structure of the cortex and cell density are similar in p73+/+ versus p73−/− animals and that, at P14–P16, there is no apparent increase in cell density. e, Relative cell number was determined by quantitating the total number of Nissl-stained cells in 574 μm (P1–P3 and P14–P16) or 287 μm (adult) strips at the rostral, caudal, and lateral levels shown in these schematic diagrams. f, g, Graphs showing the mean relative cell number at the rostral (R), caudal (C), and lateral (L) levels in coronal sections of the p73+/+ (black bars) and p73+/− (hatched bars) versus p73−/− (striped bars) cortex at P1–P3 (f) and P14–P16 (g). Asterisks are for statistical comparisons with the p73+/+ numbers. h,i, Graphs showing cortical thickness (h) and relative cell density (mean cell number per mean cell area) in cells per 1000 μm2(i) at the rostral, caudal, and lateral levels in p73+/+ (black bars) versus p73−/− (striped bars) cortex. In all graphs except i, results represent mean ± SEM. *p < 0.05; **p < 0.005; ***p < 0.001. Ini, no error bars are shown because the relative cell density was calculated and not directly measured.