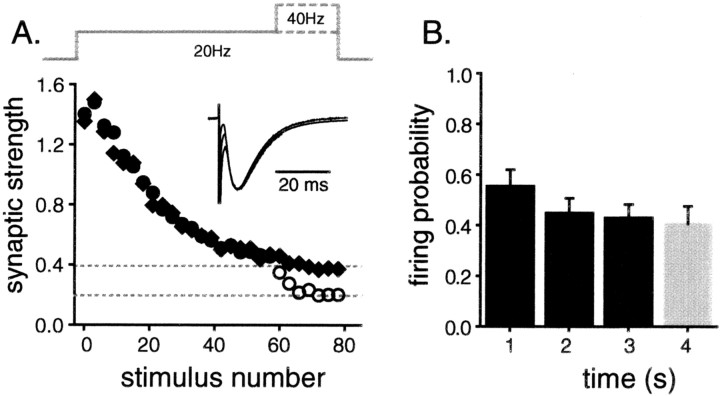
Fig. 1.
The RRP is emptied by 60 action potentials at 20 Hz. A, Schaffer collaterals were stimulated 60 times at 20 Hz and then 21 more times either at 40 or 20 Hz while postsynaptic responses were recorded by patch clamping CA1 pyramidal neuron somata. Fluctuations caused by the quantal nature of transmitter release, including frequent transmission failures, dominated the recordings during the 40 Hz stimulation, and so traces were averaged across all experiments before being measured (each point represents the average of 18 trials from 4 slices). The synaptic response sizes were binned in groups of three, normalized by the size of the first response, and plotted versus the stimulus number.Diamonds represent responses of synapses stimulated at 20 Hz throughout; circles are from trials where the frequency was doubled. The filled circles represent 20 Hz responses; the open circles are 40 Hz responses. The value of the first bin is greater than 1 because of the short-term enhancement apparent during the first several responses. The top gray dashed line matches the steady-state response size for the last 21 responses when recorded at 20 Hz; the bottom line is drawn at exactly half that. Note that during the 40 Hz stimulation, the synaptic strength quickly settled to half that recorded at 20 Hz, matching the bottom dashed line and indicating that the RRP is left exhausted by the first 60 action potentials. Inset, The averages of the first 10 individual responses at 20 Hz, responses numbered 51–60 at 20 Hz, and the first 10 responses at 40 Hz are all scaled by their peak size and overlaid. Because the individual responses evoked at 40 Hz do not decay away completely in the 25 msec interstimulus interval, the corresponding tail of the average 20 Hz response was first scaled to match the prestimulus artifact baseline and then subtracted from the average 40 Hz response. Note that the shape of the EPSC did not change during the experiment. B, The stimulus intensity was set within the narrow threshold window as described in Results, and antidromic action potentials were recorded in CA3 pyramidal neurons as Schaffer collaterals were stimulated repetitively for 3 sec at 20 Hz and then for 1 sec at 40 Hz. The average probability of action potential firing given a stimulus (47 experiments, 2 neurons) was calculated for each second of stimulation and plotted versus time. Note that the firing probability did not change when the stimulus frequency was doubled (compare bars 3 and4).

