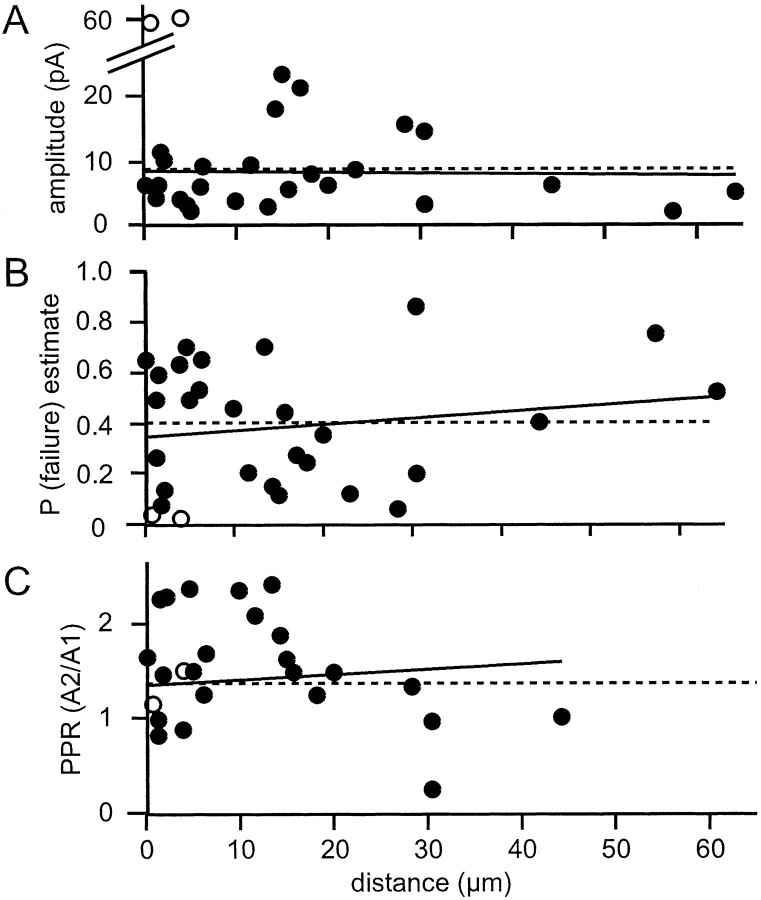
Fig. 10.
The properties of connections from proximal connections are similar to those of parallel fiber connections. Shown are plots of connection amplitude (A), estimated failure probability (B), and paired pulse ratio (C) as a function of distance from the Purkinje cell dendritic plane. Dashed lines represent the mean values for parallel fiber connections, and the solid lines are the best-fit lines. The two large amplitude connections (open circles) were excluded from the regression calculation for the amplitudes. Note that the meanP(failure) estimate (B) represented by the dashed line is for the parallel fiber connections shown in Figure 5A.

