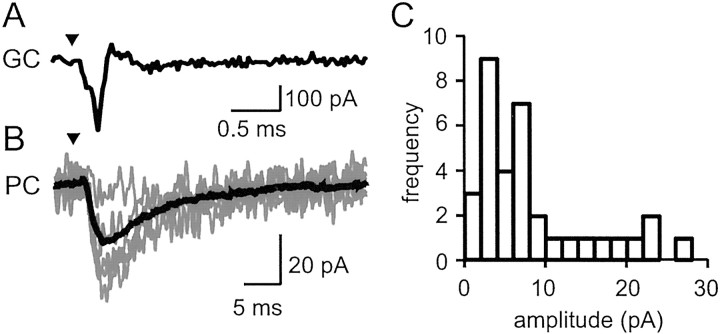
Fig. 2.
Unitary parallel fiber→Purkinje cell connections. A, A granule cell action potential evoked and recorded in loose cell-attached mode. Stimulus timing is indicated by the triangle. The stimulus artifact has been subtracted (see Materials and Methods). B, Several EPSCs recorded in the Purkinje cell (fine lines) plus the average EPSC (thick line; n = 116). Note the slower time base. C, Histogram of the mean amplitudes for all detected EPSCs (n = 34 of 477) of granule cells 300–500 μm from the recorded Purkinje cell. The distribution parameters are reported in Results.

