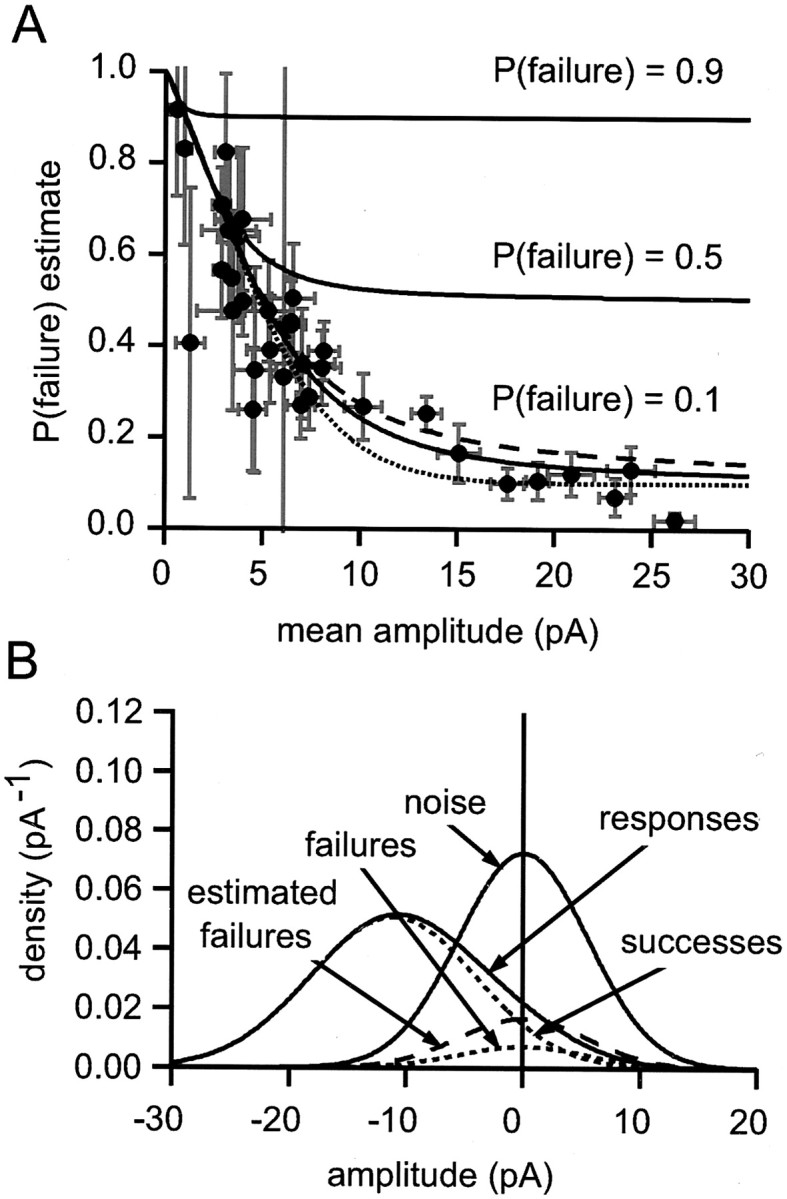
Fig. 5.

Distribution of failure probability estimates for parallel fiber synapses. A, The failure probability estimates are plotted as a function of mean amplitude with their bootstrap SE estimates. The smooth curves (solidlines) are relations obtained by using the model illustrated in B. Each theoretical relation is for a fixed underlying failure probability (labeled). B, Illustration of the model used to calculate the theoretical curves inA. A Gaussian noise distribution (SD of 5.8 pA;noise, shown by a solid line) was convolved with a Gaussian success amplitude distribution [probability of 0.9, amplitude of 11.11 pA, SD of 4.44 pA; therefore, coefficient of variation (CV) of 0.4] and failures (probability of 0.1, amplitude of 0). The resulting distribution components are labeledsuccesses and failures (dotted curves); their sum is the responses probability density function (solid line), which models the experimentally determined amplitude distribution. The best-fit scaled version of the noise distribution is shown also (estimated failures, shown by the dashed line). It overestimates the true failure probability by a factor of ∼2. Variation of the CV of successes had little effect on the overall shape of the amplitude-estimated P relations that were obtained. The dotted and dashed curves inA were obtained with CVs of 0.15 and 0.5, respectively.
