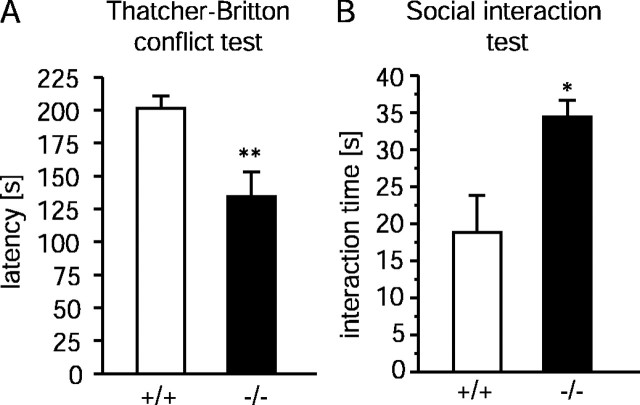
Fig. 5.
A, Thatcher-Britton novelty conflict paradigm. Error bars represent mean latency time until eating in the center of the lit open arena (±SEM) of 10 animals.B, Social interaction test. Each columnrepresents time spent with social activity in unfamiliar and aversive (high light) environment (±SEM) of 10 animals. *p≤ 0.05; **p ≤ 0.01 (Student's unpairedt test).

