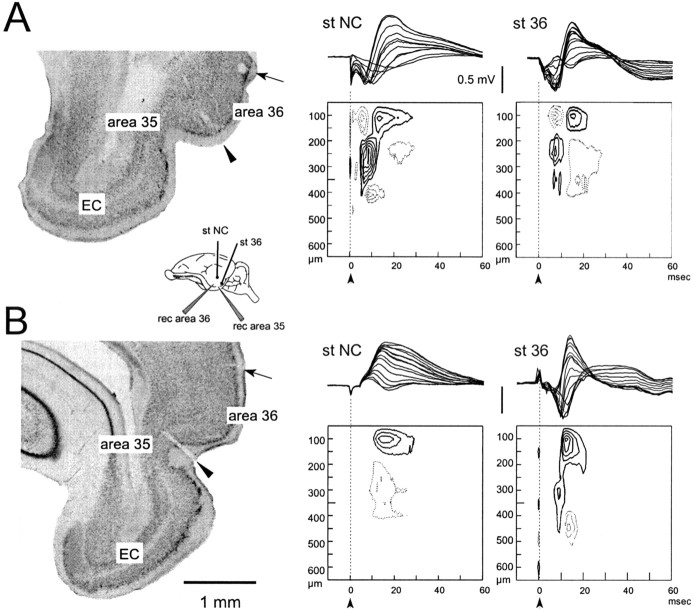
Fig. 2.
Typical field potential profiles and CSD contour plot recorded in area 36 in response to superficial stimulation of NC and area 36. In A and B, the correlation between the field potentials recorded with the multichannel silicon probe and the relative sink–source current dipoles plotted on a contour graph are shown. The field responses simultaneously recorded at each of the 16 probe sites (separated by 50 μm on a single shaft orthogonally inserted in the cortex) are illustrated by superimposition in the top part of each panel. Thecontinuous line and the dotted line in the contour plots indicate isocurrent lines referred to sinks and sources, respectively. Isocurrent lines are at 10 mV/mm2. The arrows in the contour plots mark the stimulus artifact. The recording silicon probes were inserted in area 36 (B) and area 35 (C). In the inset, a scheme of the position of the electrodes is illustrated. The histological controls in the left panels, illustrating the positions of the lesions performed by current passed through the stimulating electrode in the NC (arrow), and the lesion determined by the 16-channel silicon probe in area 36 (arrowhead) are illustrated in thionin-stained 100 μm coronal sections.

