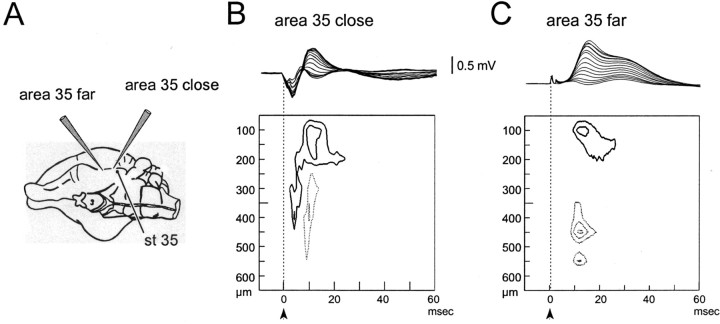
Fig. 3.
Field potential profiles and CSD contour plot recorded at two sites in area 35 located close to (<1 mm;B) and 2 mm away (C) from a stimulating electrode in area 35 itself. The two profiles were performed in the same experiment. The positions of the electrodes are illustrated in A. As for Figure 2, the field profile and the CSD contour plot are illustrated in each panel. Isocurrent lines are at 10 mV/mm2.

