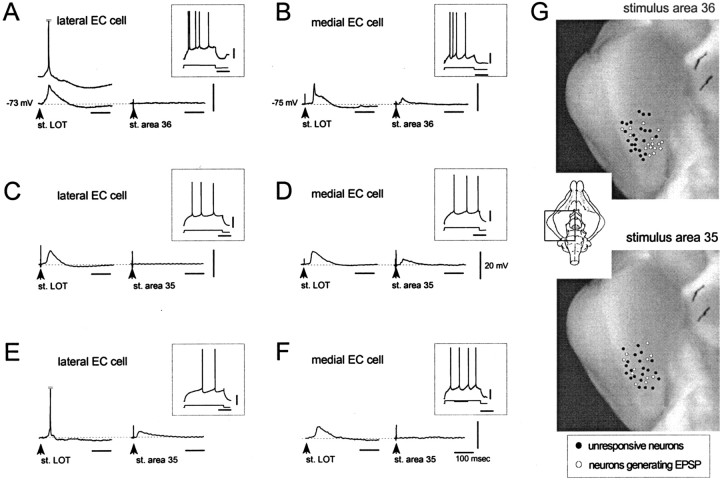
Fig. 5.
Typical activation patterns of EC layer II–III neurons recorded intracellularly in response to LOT (left traces) and PRC (right traces) stimulation. Neurons in A, C, and Ewere recorded in the l-EC; neurons in B,D, and F were recorded in m-EC. After area 36 stimulation, the large majority of l-EC cells did not respond (A), whereas m-EC neurons generated an EPSP (B). Area 35 stimulation induced EPSPs with variable delays in a subpopulation of l-EC and m-EC cells (D, E). The same stimulus was ineffective in other EC neurons (C, F).G, Distribution of EC neurons that generated an EPSP (open circles) and of cells unresponsive (filled circles) to stimuli applied to area 36 (top panel) and area 35 (bottom panel). The large majority of neurons activated by area 36 stimulation were located in the m-EC and responded with a late, polysynaptic EPSP. The neurons that responded to area 35 stimulation with EPSPs of variable delays were scattered in both l-EC and m-EC.

