
Fig. 2.
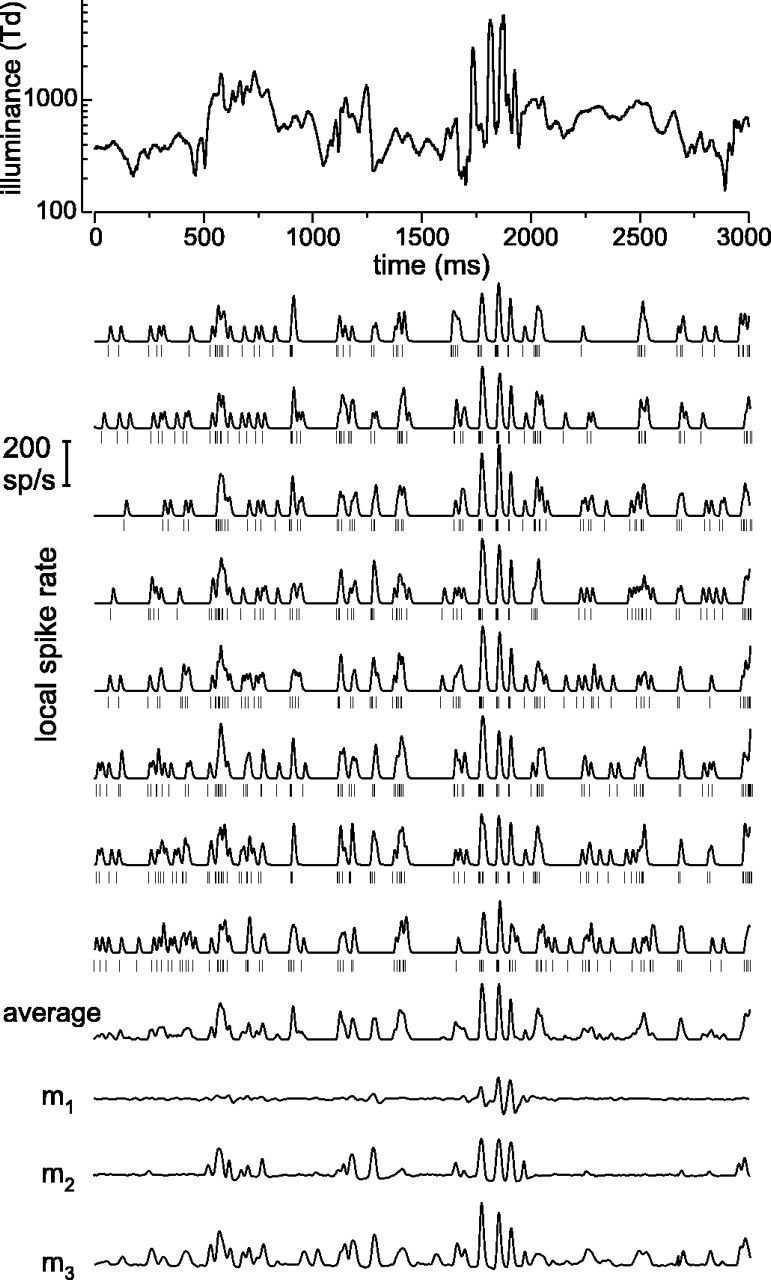
Examples of responses of an on-center MC cell and model responses. The top eight rows of spike rates show eight different responses of the same cell to the stimulus shown at thetop (3 sec of a 10 min stimulus; laboratory environment). The short vertical bars show the timing of individual spikes; local spike rate was estimated here by filtering this spike train with a low-pass filter with a full width at half-maximum of 12.5 msec. Bottom rows show the average of the eight local spike rate traces, the response of a linear model (m1), the response of a model with a bandpass filter, a compressive nonlinearity, and a rectification (m2), and the response of the model shown in Figure 7A(m3). Parameters for modelm3(see the legend of Fig. 7A) were τ1 = 6.9 msec, τ2 = 60 msec, k1 = 1.2 · 10−2td−1/2, τ+ = 10 msec,c1 = 9.5 · 10−3,q0 = 0.57,q1 = 8.7,c2 = 1.8 · 10−4, τ3 = 208 msec, and k2 = 1.1.