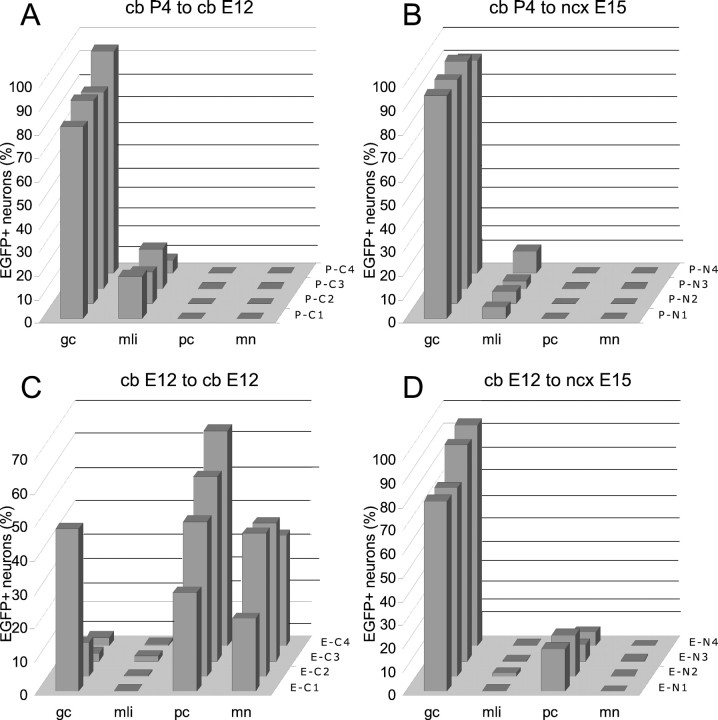
Fig. 8.
A–D, Quantitative analysis of the phenotypic repertoire generated by postnatal (A, B) and embryonic (C, D) cerebellar cells transplanted to cerebellar (A, C) or neocortical (B, D) explants. Each histogram shows the distribution of neuron phenotypes generated by grafted cells in four representative explants from each experimental set (indicated on the z-axis of each histogram). The different cell types are represented as the percentage on the total number of transplanted neurons observed in the relevant explant.gc, Granule cells; mli, molecular layer interneurons; pc, Purkinje cells; mn, multipolar neurons; cb, brainstem-cerebellar explant;ncx, neocortical explant.

