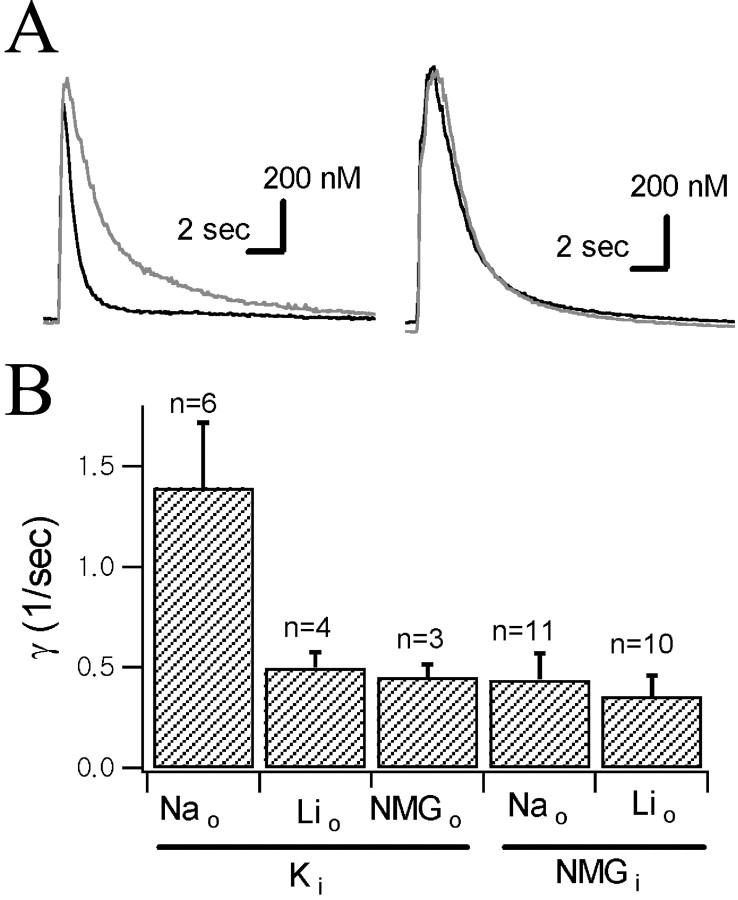
Fig. 4.
[K+]i dependence of Ca2+ decay rate. A, Representative Ca2+ transients recorded with a K+ pipette (left) and with an NMG+ pipette (right). A Ca2+ transient recorded at 145 mm[Na+]o (black traces) and that recorded at 20 mm[Na+]o (gray traces; Na+ was replaced by Li+) were superimposed. B, Mean Ca2+ decay rate constants (γt=0) of Ca2+transients under conditions indicated below theabscissa. Subscripto andi represent external and internal major cations, respectively.

