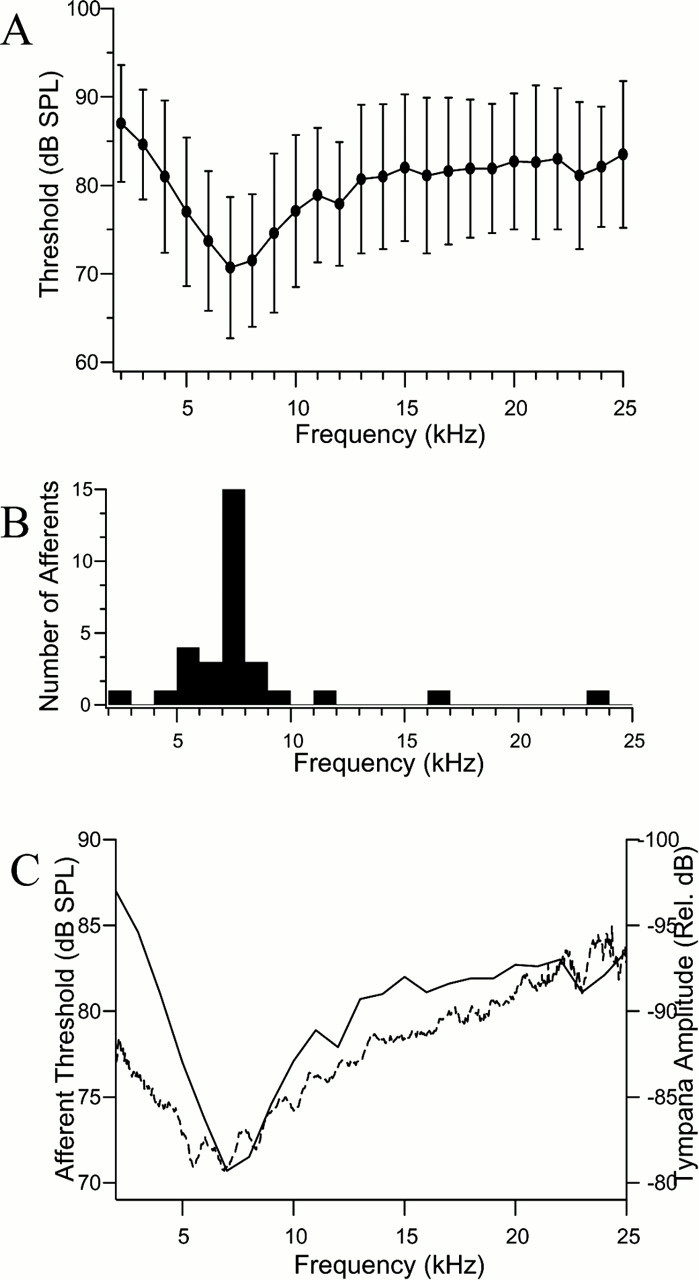
Fig. 2.

Summary of the frequency threshold response in the auditory afferents of Ormia ochracea. A,Average ± SDs for 28 afferents (type 1, type 2, and type 3) obtained with 10 msec pulses repeated at 1 Hz. B,Histogram of the number of afferents with best frequencies at a particular frequency. These data were compiled from the same tuning curves that are averaged in A. C,Comparison of the average tuning of the afferents in this study (solid line, left ordinate) with the membrane displacement measured with laser vibrometry measured in relative decibels (dotted line, right ordinate). The membrane response amplitude was measured with laser vibrometry, using a broad band white noise stimulus between 1 and 25 kHz (Robert et al., 1996).
