
Fig. 1.
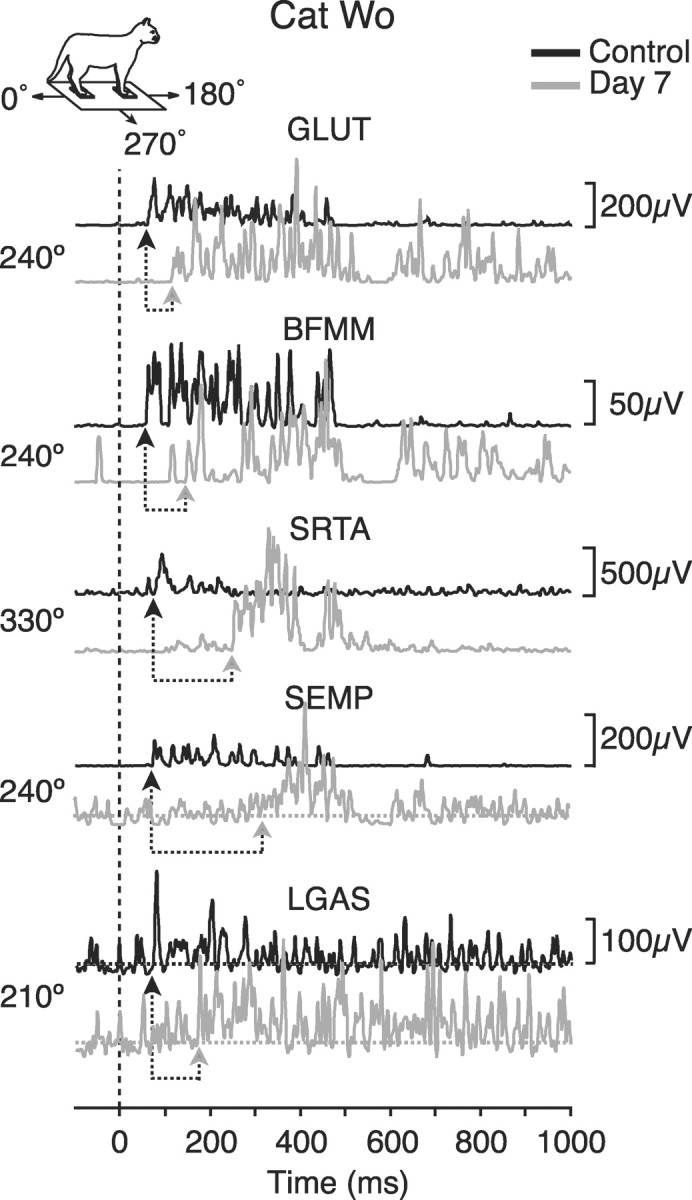
Representative averaged EMG activity of hindlimb muscles for cat Wo before (black) and on day 7 after pyridoxine (gray). The translation directions that are illustrated are those for which each muscle was activated maximally in the control condition. The dashed vertical line indicates the onset of platform acceleration. For muscles SEMP and LGAS the baseline EMG activity is indicated byhorizontal dotted lines to clarify initial burst onset. Under each trace, arrows indicate response onset during control trials and at day 7. GLUT, Gluteus medius;BFMM, middle biceps femoris; SRTA, anterior sartorius; SEMP, posterior semimembranosus;LGAS, lateral gastrocnemius. Inset shows coordinate reference for direction of translation.