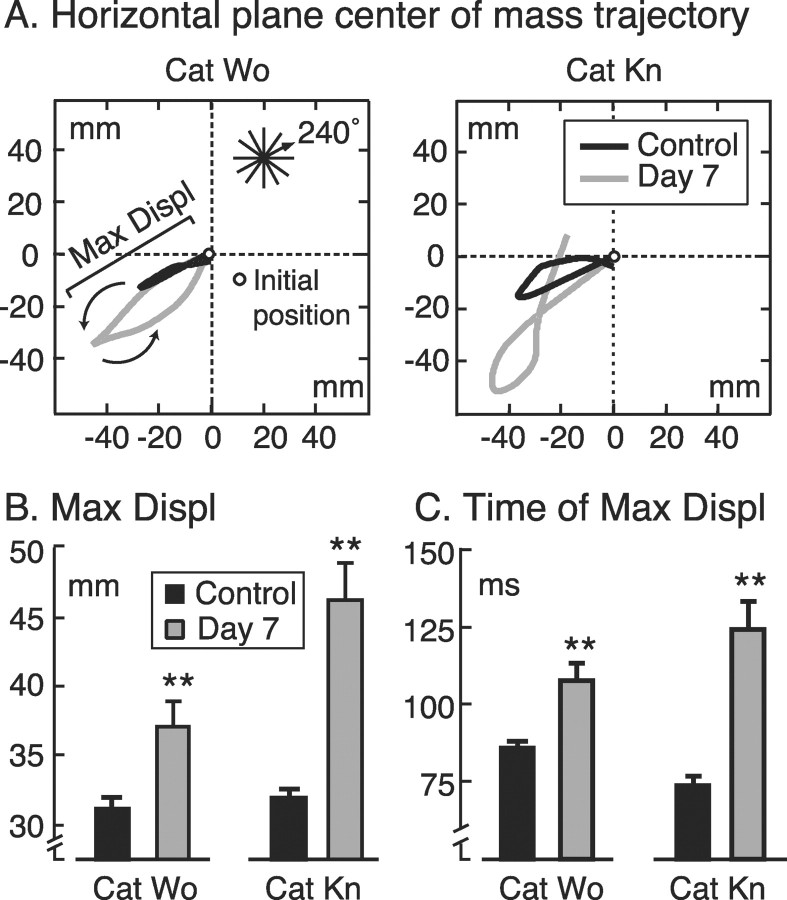
Fig. 2.
A, Representative horizontal plane center of mass (CoM) trajectories for each cat in control (black) and postpyridoxine (gray) conditions for one selected direction (240°). For comparison, control and postpyridoxine trajectories are aligned to the same initial position (open circles). B, Amplitude of maximum initial displacement of the CoM from its origin (see region labeled Max Displ in A).C, Time of maximum displacement with respect to the onset of platform translation. Error bars indicate SE. **Significantly different from control values (p < 0.001).

