
Fig. 3.
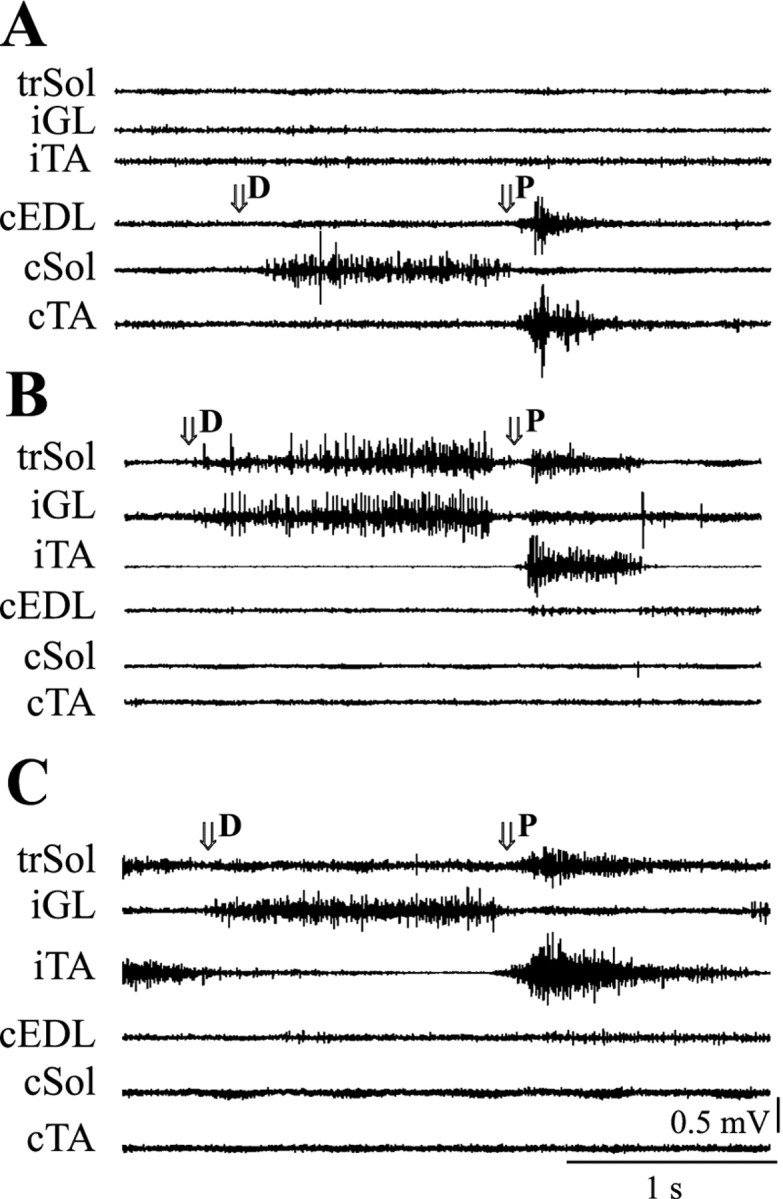
Reflex EMG activity of selected muscles during dorsiflexion (D) and plantar flexion (P) at the ankle joint in two rats from group A.A shows a typical response during dorsiflexion and plantar flexion in a control hindlimb. B shows a partially modified response in an operated hindlimb from the same animal. Note that the trSol responded both to dorsiflexion and plantar flexion. C shows fully modified responses of the trSol in another animal. Note the lack of response in the trSol during dorsiflexion and the clear effect of plantar flexion. Thearrows show the beginning of dorsiflexion and plantar flexion. Other denotations are as in Figure 2.