
Fig. 2.
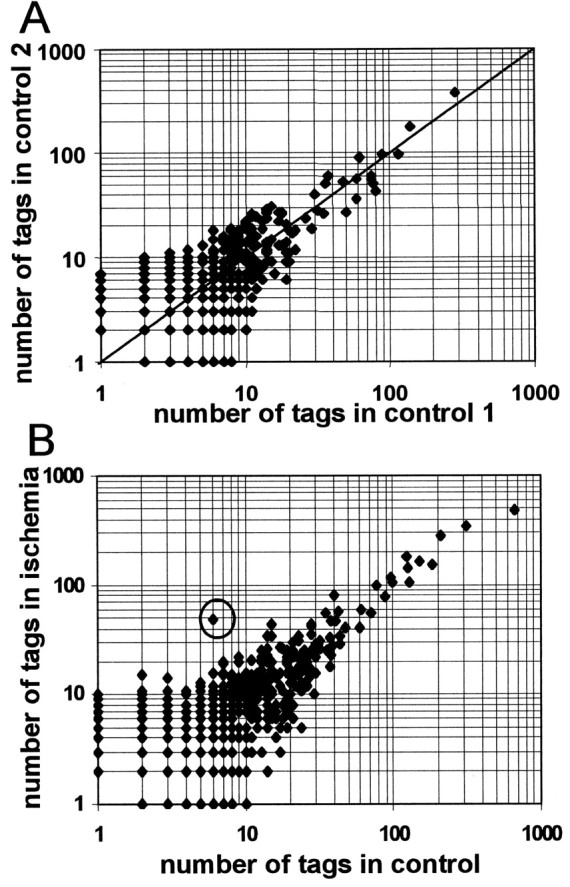
A, Reproducibility of SAGE. Total RNA derived from whole C57BL/6 mouse brain of four mice was pooled, and SAGE was performed with two fractions separately. Respectively, 15,869 tags (control 1) and 15,757 tags (control 2) were generated and used to compare absolute tag counts in each control experiment. Data points in the figure represent different transcripts; values on the x-axis correspond to absolute tag numbers in control 1; values on the y-axis correspond to absolute tag numbers in control 2. No ratio >2 was observed for tag counts >31 in controls 1 or 2. Linker-derived tags were excluded. Data are expressed in double logarithmic scale. B, MT-II is the most significantly upregulated transcript after focal ischemia in the mouse brain detected by SAGE. Data points belong to the different transcripts. The x- and y-axes represent absolute tag numbers in control brains and in postischemic brains, respectively. The dot for MT-II is marked by acircle.