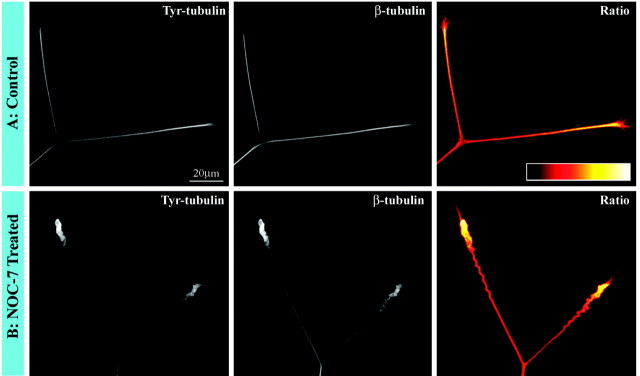
Fig. 6.
Analyses on the ratio of tyrosinated/total tubulin in microtubules during axonal retraction. A, Control axons. B, Axons retracting in response to treatment for 30 min with NOC-7. The first panel of each set shows staining for tyrosinated tubulin, whereas the second panel shows staining for total β-tubulin. Tyrosinated tubulin staining is brighter distally, but so too is total tubulin. Thethird panel of each set shows a ratio image of tyrosinated/total tubulin (see Materials and Methods and Results). The ratio image is displayed in a pseudocolor scale in whichwhite is the most intense and black is the least intense. (There is no white in these axons; hence,yellow is the brightest.) Note that the ratio is clearly highest distally in the control axons, indicating a concentration of microtubules particularly rich in tyrosinated tubulin. This same distal concentration is observed in retracting axons, indicating no loss in the distal enrichment of these tyrosinated tubulin-rich microtubules. Scale bar, 20 μm.

