
Fig. 3.
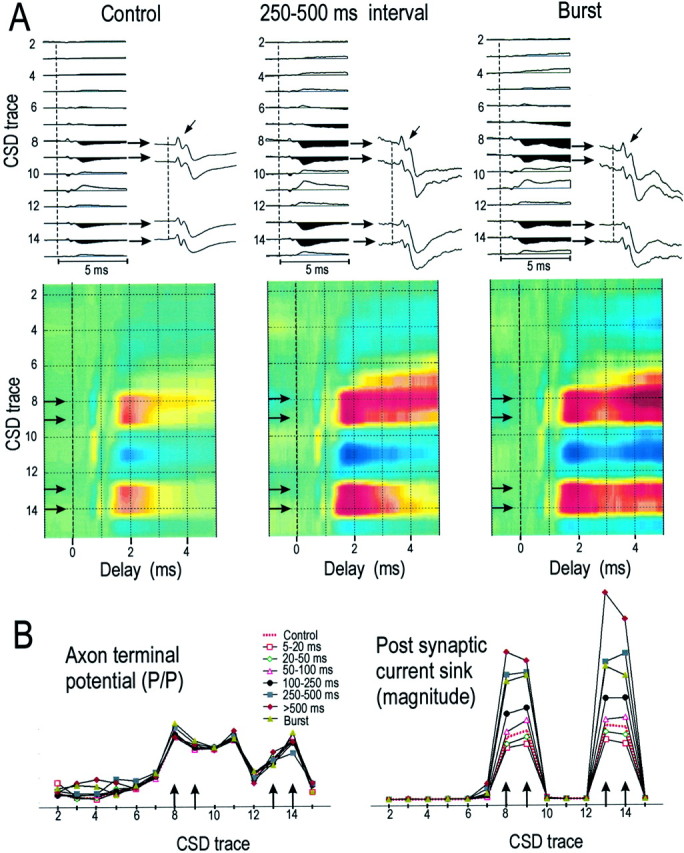
A, CSD profiles for another TC neuron. The control profile is shown on the left(n = ∼120,000 TC spikes), with an amplified view (gain is 3.5 times greater) of the responses in layer 4 (top horizontal arrows) and layer 6 (bottom horizontal arrows). Oblique arrows indicate axon-terminal responses. The colorized CSD profile is shown below.Middle profiles were generated by TC spikes with preceding interspike intervals of 250–500 msec (n= 2290). Profiles on the right were generated by initial spikes of TC bursts (n = 2427). Gain settings and color intensities for all CSDs are identical. The vertical dashed lines indicate the time of the TC action potential.B, The amplitude (peak–peak) of the axon-terminal response (left) and the magnitude of the initial 1 msec of the postsynaptic current sink (right) were plotted at different CSD sites as a function of preceding interspike interval. Control response and the response to the initial spike in a TC burst are also plotted.