Fig. 5.
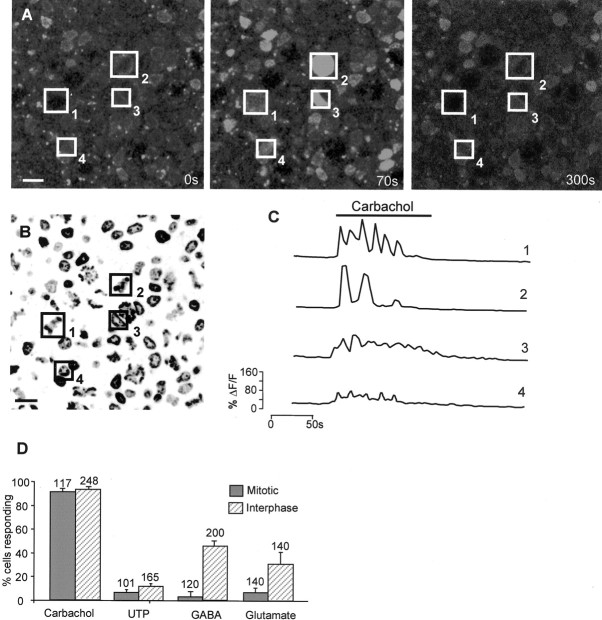
The mitotic and interphase VZ cell populations respond to different agonists. A–C, Changes in [Ca2+]i can be correlated with the mitotic status of individual cells. A, Confocal image of flat-mount E6 retina labeled with Fluo-4 AM. Four cells are indicated by numbered boxes and show increased fluorescence in the presence of carbachol (center panel).Left, center, and rightpanels correspond to 0, 70, and 300 sec, respectively.B, Hoechst 33342 image of the same region shown inA reveals that cells1 and2 are mitotic, and 3 and 4are in interphase. Scale bar, 5 μm. C, Changes in [Ca2+]i (ΔF/F) in cells1–4 during drug application.D, At E6, most cells respond to carbachol, and smaller numbers respond to UTP, GABA, and glutamate. Responses to UTP (100 μm) and carbachol (100 μm) arose equally from the mitotic and the interphase populations, whereas those to GABA (100 μm) and glutamate (100 μm) were predominantly from the interphase cells. Values plotted are mean ± SEM; N = 4.

