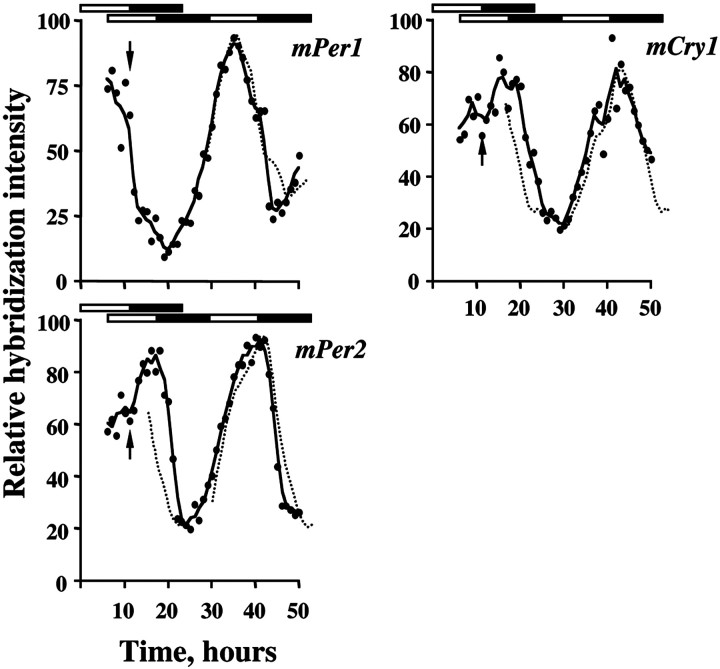
Fig. 4.
Rapid readjustment of rhythmic expression ofmPer and mCry mRNAs in SCN of mice subjected to an acute 6 hr phase delay. Data plotted as hourly means (circles; 3 mice/hr) and as a three-point moving average for the hourly data (solid line). For comparison, the baseline data are plotted in their original phase (dotted line, left panel) and with a predicted 6 hr delay on the second cycle after the shift (dotted line, right panel). Bars depict original (top bar) and shifted photoschedules (bottom bars).Arrow indicates time of exposure to unanticipated nocturnal light.

