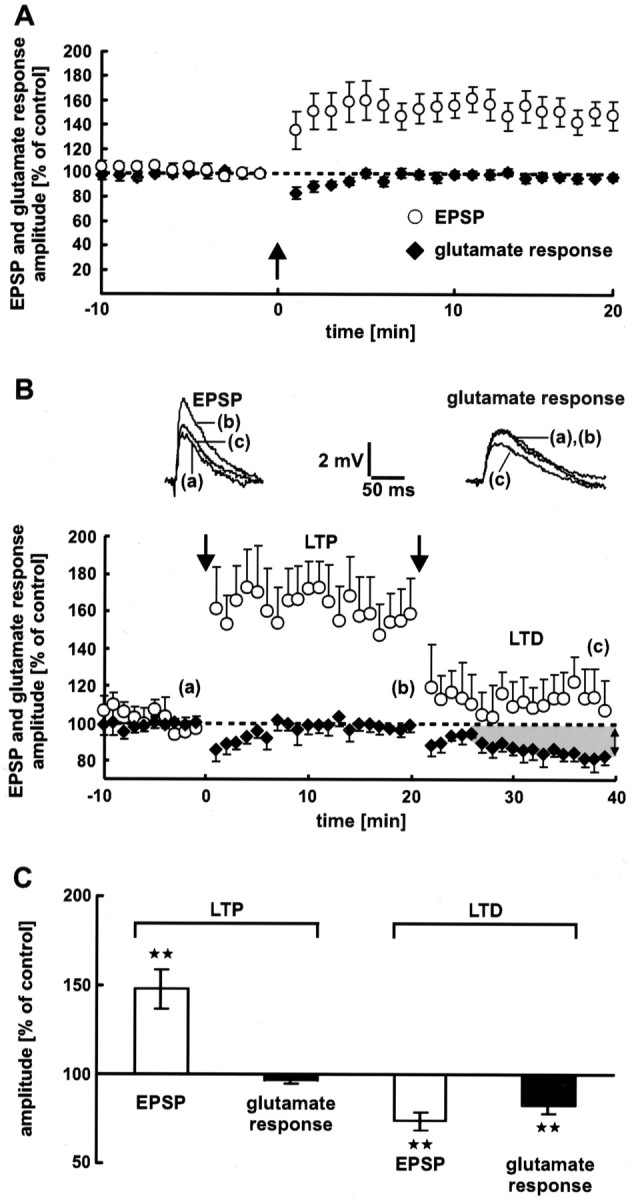
Fig. 6.

Neocortical synaptic LTP. A, Electrical stimulation (arrow) induces LTP of EPSPs. During LTP, the dendritic glutamate sensitivity does not change. Averages of 12 neurons are shown. B, Dendritic glutamate sensitivity during synaptic LTP and LTD successively induced at the same synapses. LTP and LTD were induced by electrical 5 Hz stimulation (n = 7 neurons). The stimulation intensities used for LTP and LTD induction were 2.5× and 2× the threshold of spike generation, respectively. The dendritic glutamate sensitivity during LTP remains constant. In contrast, LTD is associated with a decrease in the glutamate response amplitude. The traces show single EPSPs and glutamate responses. Dashed lines represent the 100% value. C, Statistical evaluation of the experiments shown in A and B. A high significant difference (p < 0.01) from the control value is indicated by the stars. As a control value for LTD, the mean of the last 5 min (16–20 min) before LTD induction was used. During synaptic LTP, the glutamate response amplitude shows no significant difference (p= 0.1).
